
Datadog 模型上下文协议 (MCP) 🔍
一个基于 Python 的工具,用于与 Datadog API 交互并从您的基础架构获取监控数据。此 MCP 通过简单的界面提供对监控状态和 Kubernetes 日志的轻松访问。
Datadog 功能🌟
监控状态跟踪:获取并分析特定的监控状态
Kubernetes 日志分析:从 Kubernetes 集群中提取并格式化错误日志
Related MCP server: MongoDB MCP Server
先决条件📋
Python 3.11+
Datadog API 和应用程序密钥(具有正确的权限)
访问 Datadog 网站
安装🔧
通过 Smithery 安装
要通过Smithery自动为 Claude Desktop 安装 Datadog:
npx -y @smithery/cli install @didlawowo/mcp-collection --client claude所需软件包:
datadog-api-client
fastmcp
loguru
icecream
python-dotenv
uv
环境设置🔑
使用您的 Datadog 凭证创建一个.env文件:
DD_API_KEY=your_api_key
DD_APP_KEY=your_app_key
为 MCP 设置 Claude 桌面设置 🖥️
安装 Claude Desktop
# Assuming you're on macOS
brew install claude-desktop

# Or download from official website
https://claude.ai/desktop
设置 Datadog MCP 配置:
# on mac is
~/Library/Application\ Support/Claude/claude_desktop_config.json


# Add this to your claude config json
```json
    "Datadog-MCP-Server": {
      "command": "uv",
      "args": [
        "run",
        "--with",
        "datadog-api-client",
        "--with",
        "fastmcp",
        "--with",
        "icecream",
        "--with",
        "loguru",
        "--with",
        "python-dotenv",
        "fastmcp",
        "run",
        "/your-path/mcp-collection/datadog/main.py"
      ],
      "env": {
        "DD_API_KEY": "xxxx",
        "DD_APP_KEY": "xxx"
      }
    },
用法💻
建筑🏗
FastMCP Base :利用 FastMCP 框架进行工具管理
模块化设计:监视器和日志的独立功能
类型安全:通过 Python 类型提示提供全面的类型支持
API 抽象:包装 Datadog API 调用并进行错误处理
我将添加有关 MCP 和 Claude Desktop 设置的部分:
模型上下文协议(MCP)简介🤖
什么是 MCP?
模型上下文协议 (MCP) 是一个框架,允许 AI 模型以标准化的方式与外部工具和 API 交互。它使 Claude 等模型能够:
访问外部数据
执行命令
与 API 交互
在对话中保持上下文
MCP 服务器的一些示例
https://github.com/punkpeye/awesome-mcp-servers?tab=readme-ov-file
MCP 设置教程
工作原理 - 可用功能🛠️
LLM 使用提供的函数来获取数据并使用它
1. 获取监控状态
get_monitor_states(
    name: str,           # Monitor name to search
    timeframe: int = 1   # Hours to look back
)
例子:
response = get_monitor_states(name="traefik")

# Sample Output
{
    "id": "12345678",
    "name": "traefik",
    "status": "OK",
    "query": "avg(last_5m):avg:traefik.response_time{*} > 1000",
    "message": "Response time is too high",
    "type": "metric alert",
    "created": "2024-01-14T10:00:00Z",
    "modified": "2024-01-14T15:30:00Z"
}
2. 获取 Kubernetes 日志
get_k8s_logs(
    cluster: str,            # Kubernetes cluster name
    timeframe: int = 5,      # Hours to look back
    namespace: str = None    # Optional namespace filter
)
例子:
logs = get_k8s_logs(
    cluster="prod-cluster",
    timeframe=3,
    namespace="default"
)

# Sample Output
{
    "timestamp": "2024-01-14T22:00:00Z",
    "host": "worker-1",
    "service": "nginx-ingress",
    "pod_name": "nginx-ingress-controller-abc123",
    "namespace": "default",
    "container_name": "controller",
    "message": "Connection refused",
    "status": "error"
}
# Install as MCP extension
cd datadog
task install-mcp4.验证安装
在克劳德的聊天桌面
检查 Claude 中的 Datadog 连接
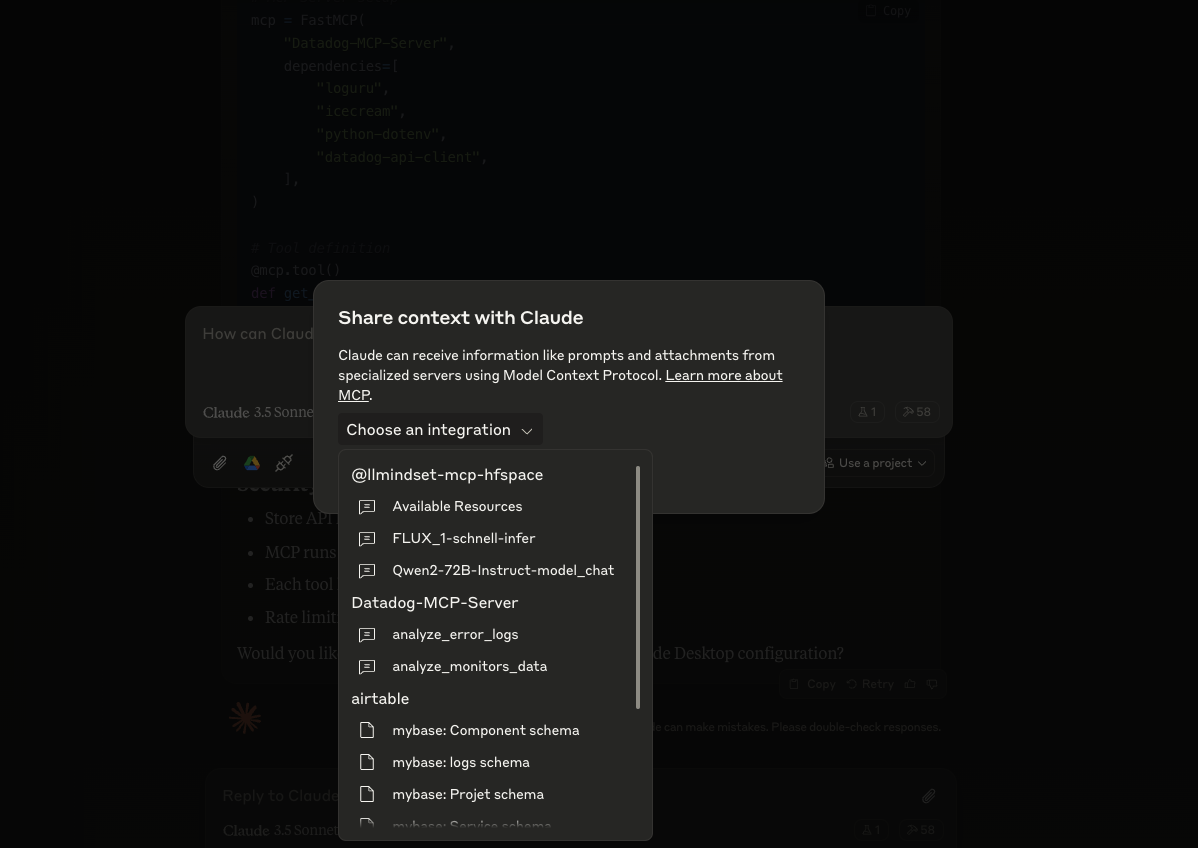
5. 使用 Datadog MCP 工具
安全注意事项
将 API 密钥存储在
.env中MCP 在隔离环境中运行
每个工具都有定义的权限
实施速率限制
故障排除
使用 MCP 检查器
# Launch MCP Inspector for debugging
task run-mcp-inspector
MCP 检查器提供:
实时查看MCP服务器状态
函数调用日志
错误追踪
API响应监控
常见问题和解决方案
API 身份验证错误
Error: (403) Forbidden➡️ 检查 .env 中的 DD_API_KEY 和 DD_APP_KEY
MCP 连接问题
Error: Failed to connect to MCP server➡️ 验证你的 claude_desktop_config.json 路径和内容
未找到监视器
Error: No monitor found with name 'xxx'➡️ 检查监视器名称拼写和大小写
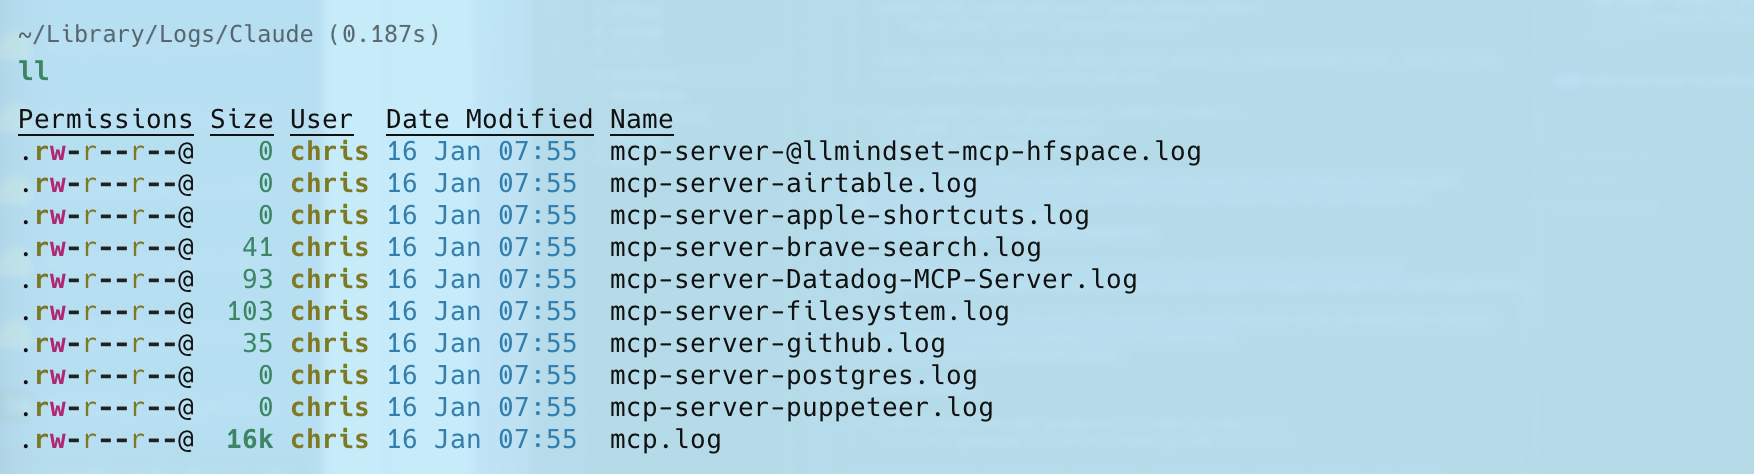
日志可以在这里找到
贡献🤝
请随意:
未解决的错误问题
提交 PR 以进行改进
添加新功能
注释📝
对 Datadog EU 站点进行 API 调用
监控状态的默认时间范围为 1 小时
设置页面大小限制以处理大多数用例
Appeared in Searches
- Combining MCP Server Aggregator
- Datadog - A monitoring and analytics platform for developers and IT operations
- A service for application performance monitoring and observability
- A platform for monitoring and analyzing system and application performance
- A platform for monitoring and analyzing data in real-time