MCP Sentry
Provides tools for retrieving and analyzing error reports from Sentry.io, including the ability to fetch detailed issue information, view stacktraces, and list issues by project to help with debugging and error monitoring.
Click on "Deploy Server".
Wait a few minutes for the server to deploy. Once ready, it will show a "Started" state.
In the chat, type
@followed by the MCP server name and your instructions, e.g., "@MCP Sentryshow me the latest issues for my-api project"
That's it! The server will respond to your query, and you can continue using it as needed.
Here is a step-by-step guide with screenshots.
mcp-sentry: A Sentry MCP server
Overview
A Model Context Protocol server for retrieving and analyzing issues from Sentry.io. This server provides tools to inspect error reports, stacktraces, and other debugging information from your Sentry account.
Tools
get_sentry_issueRetrieve and analyze a Sentry issue by ID or URL
Input:
issue_id_or_url(string): Sentry issue ID or URL to analyze
Returns: Issue details including:
Title
Issue ID
Status
Level
First seen timestamp
Last seen timestamp
Event count
Full stacktrace
get_list_issuesRetrieve and analyze Sentry issues by project slug
Input:
project_slug(string): Sentry project slug to analyzeorganization_slug(string): Sentry organization slug to analyze
Returns: List of issues with details including:
Title
Issue ID
Status
Level
First seen timestamp
Last seen timestamp
Event count
Basic issue information
Prompts
sentry-issueRetrieve issue details from Sentry
Input:
issue_id_or_url(string): Sentry issue ID or URL
Returns: Formatted issue details as conversation context
Related MCP server: MCP Server Sentry
Installation
Installing via Smithery
To install mcp-sentry for Claude Desktop automatically via Smithery:
npx -y @smithery/cli install @qianniuspace/mcp-sentry --client claudeUsing uv (recommended)
When using uv no specific installation is needed. We will
use uvx to directly run mcp-sentry.
Using PIP
Alternatively you can install mcp-sentry via pip:
pip install mcp-sentryor use uv
uv pip install -e .After installation, you can run it as a script using:
python -m mcp_sentryConfiguration
Usage with Claude Desktop
Add this to your claude_desktop_config.json:
"mcpServers": {
"sentry": {
"command": "uvx",
"args": ["mcp-sentry", "--auth-token", "YOUR_SENTRY_TOKEN","--project-slug" ,"YOUR_PROJECT_SLUG", "--organization-slug","YOUR_ORGANIZATION_SLUG"]
}
}"mcpServers": {
"sentry": {
"command": "docker",
"args": ["run", "-i", "--rm", "mcp/sentry", "--auth-token", "YOUR_SENTRY_TOKEN","--project-slug" ,"YOUR_PROJECT_SLUG", "--organization-slug","YOUR_ORGANIZATION_SLUG"]
}
}"mcpServers": {
"sentry": {
"command": "python",
"args": ["-m", "mcp_sentry", "--auth-token", "YOUR_SENTRY_TOKEN","--project-slug" ,"YOUR_PROJECT_SLUG", "--organization-slug","YOUR_ORGANIZATION_SLUG"]
}
}Usage with Zed
Add to your Zed settings.json:
For Example Curson
"context_servers": [
"mcp-sentry": {
"command": {
"path": "uvx",
"args": ["mcp-sentry", "--auth-token", "YOUR_SENTRY_TOKEN","--project-slug" ,"YOUR_PROJECT_SLUG", "--organization-slug","YOUR_ORGANIZATION_SLUG"]
}
}
],"context_servers": {
"mcp-sentry": {
"command": "python",
"args": ["-m", "mcp_sentry", "--auth-token", "YOUR_SENTRY_TOKEN","--project-slug" ,"YOUR_PROJECT_SLUG", "--organization-slug","YOUR_ORGANIZATION_SLUG"]
}
},"context_servers": {
"sentry": {
"command": "python",
"args": [
"-m",
"mcp_sentry",
"--auth-token",
"YOUR_SENTRY_TOKEN",
"--project-slug",
"YOUR_PROJECT_SLUG",
"--organization-slug",
"YOUR_ORGANIZATION_SLUG"
],
"env": {
"PYTHONPATH": "path/to/mcp-sentry/src"
}
}
},Debugging
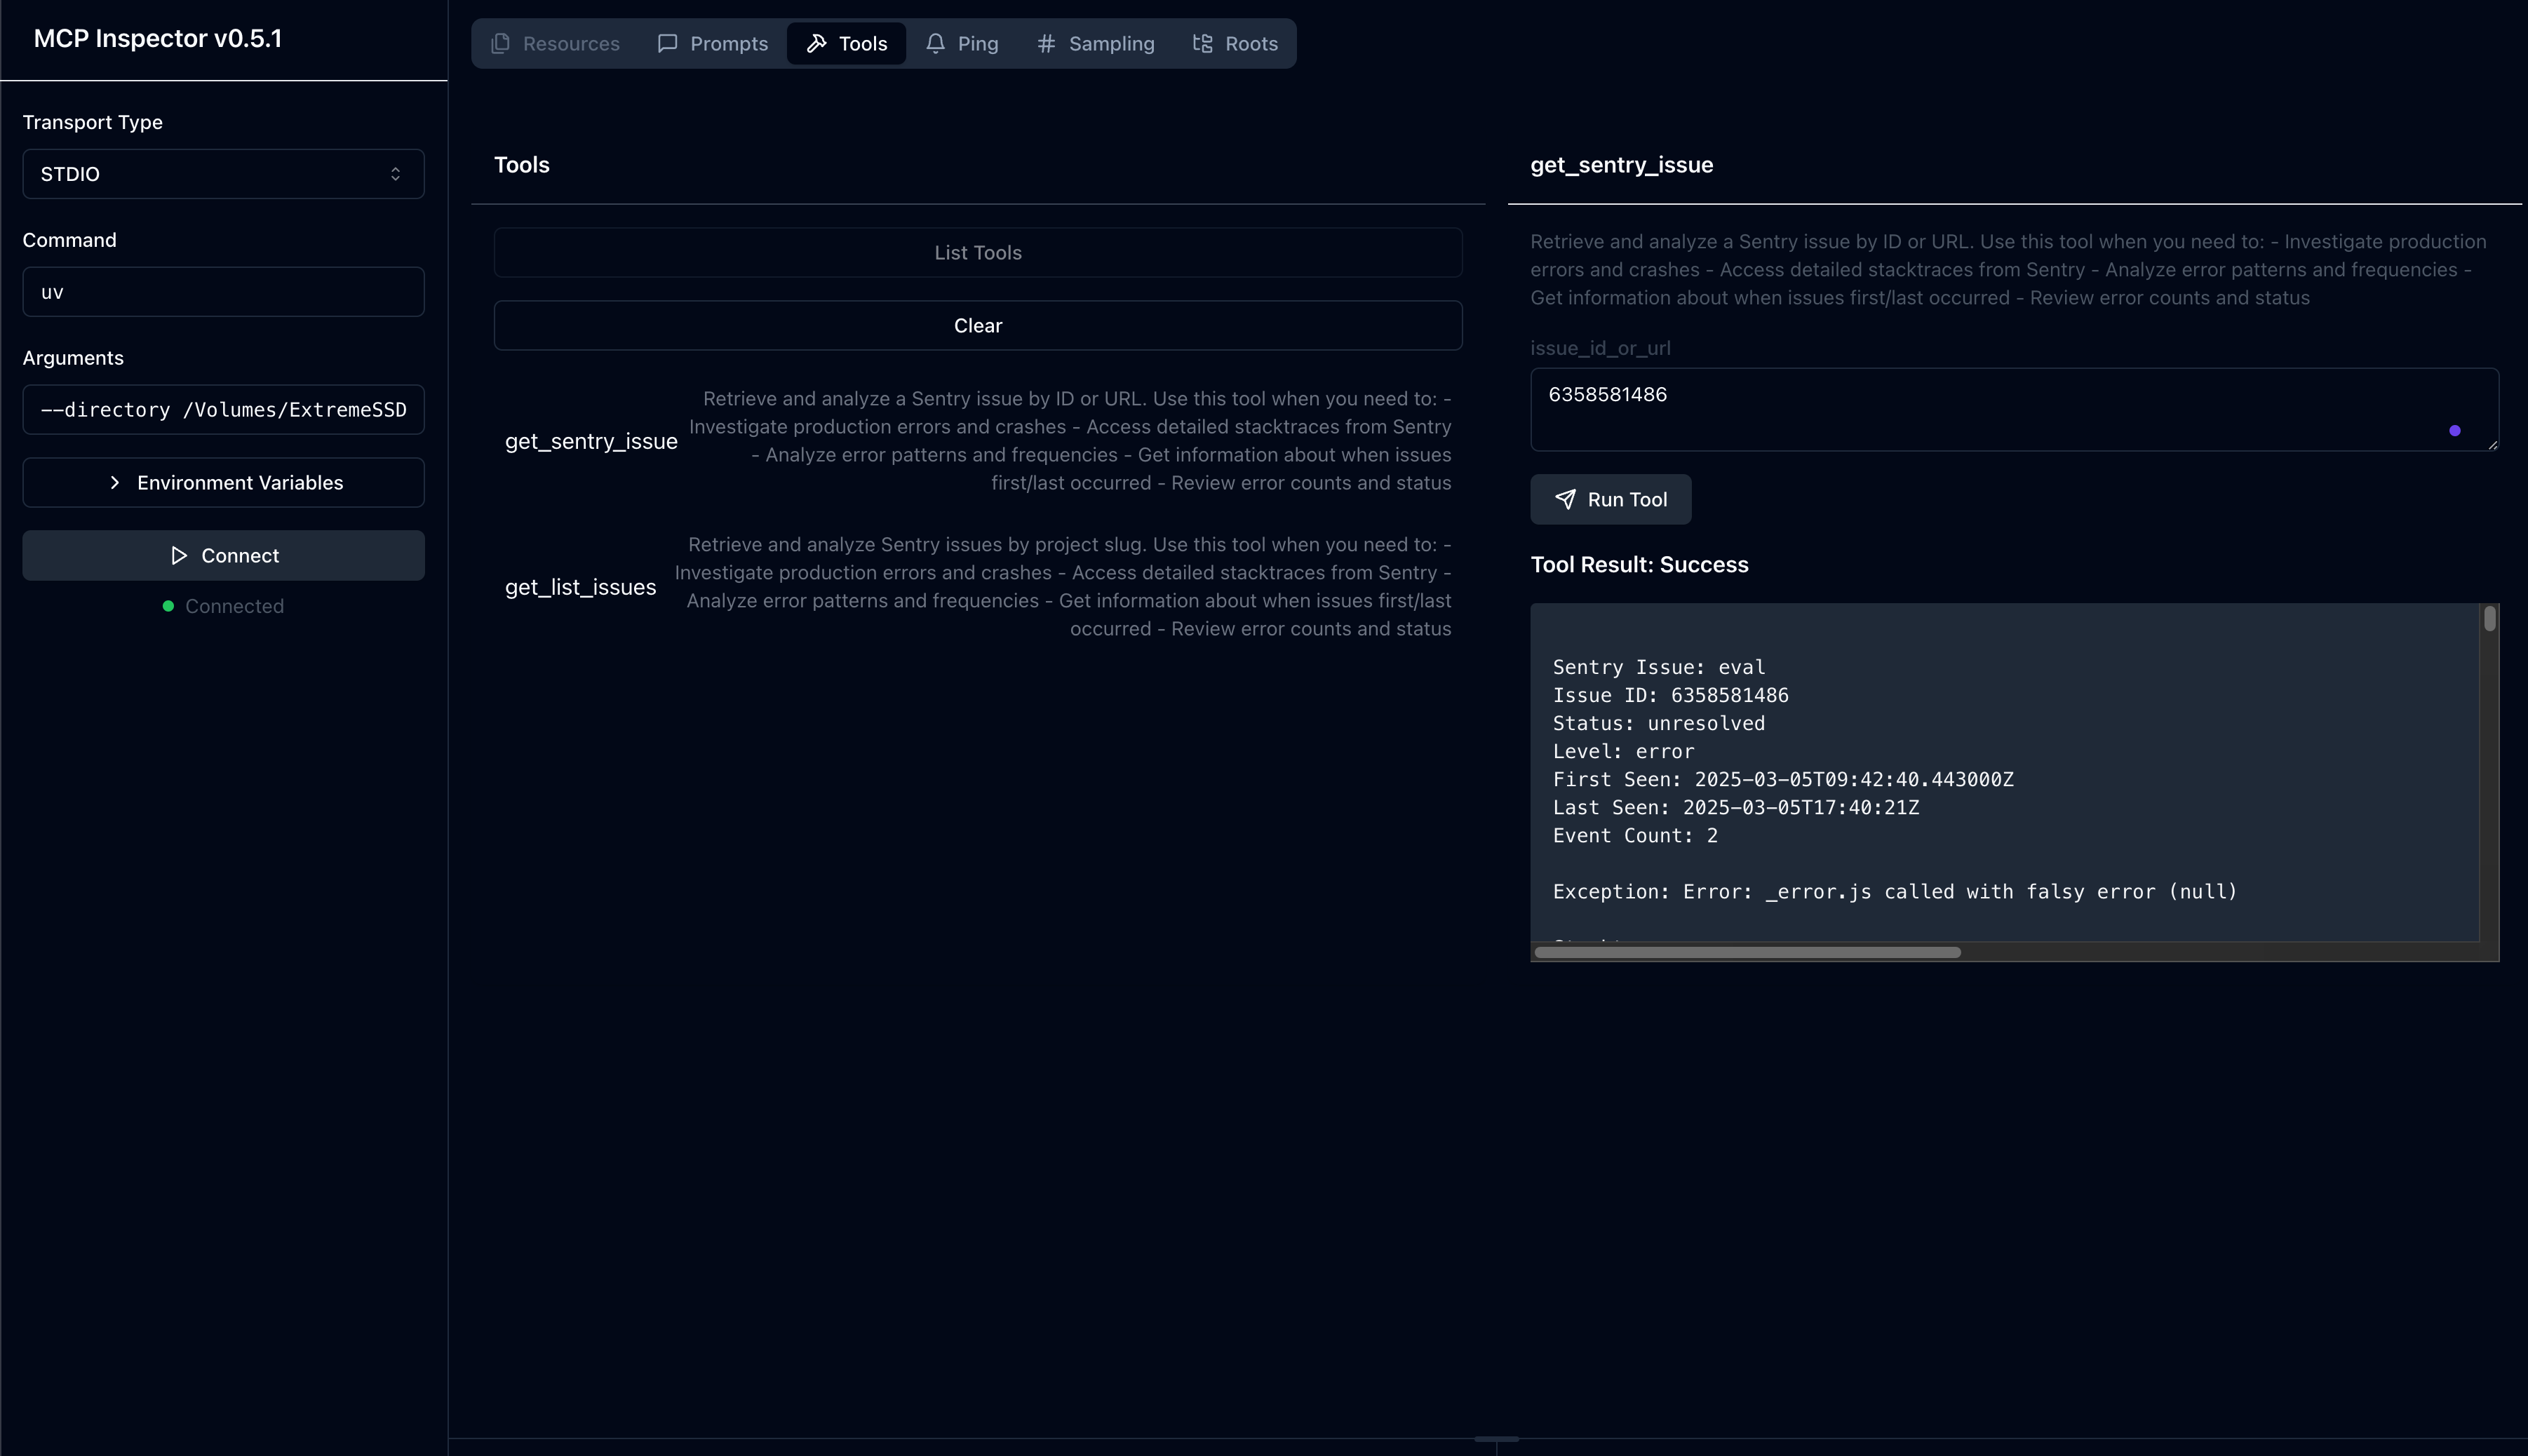
You can use the MCP inspector to debug the server. For uvx installations:
npx @modelcontextprotocol/inspector uvx mcp-sentry --auth-token YOUR_SENTRY_TOKEN --project-slug YOUR_PROJECT_SLUG --organization-slug YOUR_ORGANIZATION_SLUGOr if you've installed the package in a specific directory or are developing on it:
cd path/to/servers/src/sentry
npx @modelcontextprotocol/inspector uv run mcp-sentry --auth-token YOUR_SENTRY_TOKEN --project-slug YOUR_PROJECT_SLUG --organization-slug YOUR_ORGANIZATION_SLUG or in term
npx @modelcontextprotocol/inspector uv --directory /Volumes/ExtremeSSD/MCP/mcp-sentry/src run mcp_sentry --auth-token YOUR_SENTRY_TOKEN
--project-slug YOUR_PROJECT_SLUG --organization-slug YOUR_ORGANIZATION_SLUG
Fork From
License
This MCP server is licensed under the MIT License. This means you are free to use, modify, and distribute the software, subject to the terms and conditions of the MIT License. For more details, please see the LICENSE file in the project repository.
Available Tools
2 toolsget_list_issuesA
Retrieve and analyze Sentry issues by project slug. Use this tool when you need to: - Investigate production errors and crashes - Access detailed stacktraces from Sentry - Analyze error patterns and frequencies - Get information about when issues first/last occurred - Review error counts and status
| Name | Required | Description | Default |
|---|---|---|---|
| project_slug | No | Sentry project slug to analyze | |
| organization_slug | No | Sentry organization slug to analyze |
TDQS
Does the description disclose side effects, auth requirements, rate limits, or destructive behavior?
No annotations provided, so description carries full burden. Details what the tool retrieves (stacktraces, error patterns, frequencies, timestamps, counts, status). Does not mention side effects, rate limits, or pagination, but for a read-like operation, it is sufficiently transparent.
Agents need to know what a tool does to the world before calling it. Descriptions should go beyond structured annotations to explain consequences.
Is the description appropriately sized, front-loaded, and free of redundancy?
Single sentence followed by bullet list that is easy to scan. No extraneous information. Well front-loaded with main purpose.
Shorter descriptions cost fewer tokens and are easier for agents to parse. Every sentence should earn its place.
Given the tool's complexity, does the description cover enough for an agent to succeed on first attempt?
Tool has 2 optional parameters, no output schema. Description covers functionality well but does not explain what happens if parameters are omitted or describe return value format. Minor gaps.
Complex tools with many parameters or behaviors need more documentation. Simple tools need less. This dimension scales expectations accordingly.
Does the description clarify parameter syntax, constraints, interactions, or defaults beyond what the schema provides?
Schema covers 100% of parameters with descriptions. Description does not add extra meaning beyond the schema. Baseline of 3 is appropriate as schema is adequate.
Input schemas describe structure but not intent. Descriptions should explain non-obvious parameter relationships and valid value ranges.
Does the description clearly state what the tool does and how it differs from similar tools?
Description clearly states 'Retrieve and analyze Sentry issues by project slug' and lists specific use cases like investigating errors and accessing stacktraces. Effectively distinguishes from sibling 'get_sentry_issue' by implying this tool returns a list.
Agents choose between tools based on descriptions. A clear purpose with a specific verb and resource helps agents select the right tool.
Does the description explain when to use this tool, when not to, or what alternatives exist?
Provides explicit scenarios for when to use the tool via bullet points. Does not explicitly state when not to use, but the contrast with the sibling tool is implicit. Good guidance overall.
Agents often have multiple tools that could apply. Explicit usage guidance like "use X instead of Y when Z" prevents misuse.
get_sentry_issueA
Retrieve and analyze a Sentry issue by ID or URL. Use this tool when you need to: - Investigate production errors and crashes - Access detailed stacktraces from Sentry - Analyze error patterns and frequencies - Get information about when issues first/last occurred - Review error counts and status
| Name | Required | Description | Default |
|---|---|---|---|
| issue_id_or_url | Yes | Sentry issue ID or URL to analyze |
TDQS
Does the description disclose side effects, auth requirements, rate limits, or destructive behavior?
No annotations are provided, so the description carries full burden. It discloses what information the tool returns (stacktraces, first/last occurred, counts, status), which is helpful, but does not mention potential rate limits, authentication requirements, or data freshness. Adequate but not comprehensive.
Agents need to know what a tool does to the world before calling it. Descriptions should go beyond structured annotations to explain consequences.
Is the description appropriately sized, front-loaded, and free of redundancy?
The description is concise with two sentences plus a bullet list, front-loading the purpose. The bullet list could be slightly more compact, but overall well structured and easy to scan.
Shorter descriptions cost fewer tokens and are easier for agents to parse. Every sentence should earn its place.
Given the tool's complexity, does the description cover enough for an agent to succeed on first attempt?
For a simple retrieval tool with one parameter, no output schema, and no annotations, the description covers key use cases and return information. However, it lacks behavioral details (e.g., error handling, data freshness) that would make it fully complete for an agent.
Complex tools with many parameters or behaviors need more documentation. Simple tools need less. This dimension scales expectations accordingly.
Does the description clarify parameter syntax, constraints, interactions, or defaults beyond what the schema provides?
Schema coverage for the single parameter is 100%, and the schema already describes 'Sentry issue ID or URL'. The description repeats 'by ID or URL' in the first sentence, adding minimal additional meaning beyond the schema. Baseline 3 is appropriate.
Input schemas describe structure but not intent. Descriptions should explain non-obvious parameter relationships and valid value ranges.
Does the description clearly state what the tool does and how it differs from similar tools?
The description clearly states 'Retrieve and analyze a Sentry issue by ID or URL' and lists specific use cases (investigate errors, access stacktraces, etc.), which distinguishes it from the sibling tool 'get_list_issues' that deals with multiple issues.
Agents choose between tools based on descriptions. A clear purpose with a specific verb and resource helps agents select the right tool.
Does the description explain when to use this tool, when not to, or what alternatives exist?
The description explicitly says 'Use this tool when you need to:' followed by a list of scenarios, providing clear usage context. However, it does not explicitly state when not to use it or mention the sibling tool as an alternative, though the sibling context from the environment suggests differentiation.
Agents often have multiple tools that could apply. Explicit usage guidance like "use X instead of Y when Z" prevents misuse.
Tool Schema Changelog
Recent tool additions, removals, and schema changes observed during successful MCP inspections.
2 tool updates
v0.6.2- First observed
get_list_issues - First observed
get_sentry_issue
TDQS
Scored across 2 tools
The two tools are essentially indistinguishable in purpose. Both descriptions are identical, listing the exact same use cases (investigate errors, access stacktraces, analyze patterns, get timing info, review counts). An agent would have no way to determine when to use get_list_issues versus get_sentry_issue since they appear to serve the same function.
Both tools follow a similar get_ prefix pattern, which provides some consistency. However, the naming is confusingly similar (get_list_issues vs get_sentry_issue) rather than clearly differentiated, and the verb-noun structure is mixed (list_issues vs sentry_issue).
With only 2 tools, this feels severely under-scoped for a Sentry integration. A production error monitoring system would typically need tools for creating issues, updating statuses, searching/filtering, accessing events, or managing projects. Two tools is too few to cover meaningful workflows.
The tool surface is severely incomplete for Sentry's domain. There are no tools for creating issues, updating issue status (resolve/ignore), searching across projects, accessing event details, managing alerts, or any administrative functions. The two existing tools appear redundant rather than complementary.
Maintenance
Related MCP Connectors
Enable secure connectivity between Sentry issues and debugging data, and LLM clients, using a Model Context Protocol (MCP) server.
A Model Context Protocol (MCP) application for automated GitHub PR analysis and issue management.…
A comprehensive Model Context Protocol (MCP) server that enables AI assistants to interact with yo…
Model Context Protocol server for Studex tools, notifications, and profile integrations
Related MCP Servers
- FlicenseBqualityFmaintenanceA Model Context Protocol server that enables AI assistants to interact with Sentry for error tracking and monitoring, allowing retrieval and analysis of error data, project management, and performance monitoring through the Sentry API.1121-
- FlicenseNot gradedqualityDmaintenanceA TypeScript implementation of a Model Context Protocol server that connects to Sentry error tracking service, allowing AI models to query and analyze error reports and events.16-
- FlicenseNot gradedqualityDmaintenanceAn MCP server that connects to Sentry.io or self-hosted Sentry instances to retrieve and analyze error reports, stack traces, and debugging information.2-

Sentry MCP Serverofficial
FlicenseBqualityFmaintenanceA Model Context Protocol server that lets AI assistants interact with the Sentry API to retrieve and analyze error data, manage projects, and monitor application performance.1111-