
F
licenseB
qualityD
maintenanceA Model Context Protocol server that enables users to kickoff and monitor deployed CrewAI workflows through Claude Desktop.
2
60
-

This MCP server lets Claude Desktop query operational status of major digital platforms via a single status tool.
List all supported platforms (status list).
Check a specific platform's status (e.g., status --github or status github).
Check all platforms at once (status --all).
Monitor AI/ML providers: OpenAI, Anthropic (Claude), Gemini/Vertex AI.
Monitor cloud infrastructure: Google Cloud, DigitalOcean, Vercel, Netlify.
Monitor developer tools: Docker, GitHub, npm, Atlassian, Supabase.
Monitor productivity/collaboration: LinkedIn, Slack, Asana, Dropbox.
Monitor web infrastructure/community: Cloudflare, Discord, Reddit.
Monitor analytics: Amplitude.
Retrieve detailed status info: overall status, non-operational components, active incidents, scheduled maintenance, and incident history where available.
Use natural language prompts in Claude to invoke appropriate status checks.
Monitors operational status of Asana platform and provides real-time updates about service availability and component health.
Tracks and reports on the operational status of Atlassian services, allowing queries about current service health and availability.
Provides detailed status information about Cloudflare's global infrastructure and services, including regional performance data and maintenance status.
Monitors the operational status of DigitalOcean's cloud infrastructure and reports on service availability and performance.
Tracks Discord platform status, offering real-time information about service availability and component health.
Monitors Dropbox service status and provides current information about platform availability and performance.
Provides detailed status information for GitHub's infrastructure, including Git operations, API requests, Actions, Webhooks, Issues, Pull Requests, and other components.
Monitors the operational status of Google Cloud Platform services and provides real-time updates about service health and availability.
Tracks Netlify platform status and provides information about service availability and performance.
Monitors the operational status of npm registry and related services, reporting on current availability and performance.
Tracks Reddit platform status and provides information about service health and component availability.
Monitors Slack's operational status and provides real-time information about service availability and component health.
Tracks the operational status of Twilio services and reports on current availability and performance metrics.
Provides detailed status information about Vercel's global edge network and deployment infrastructure, including API, Dashboard, Builds, Serverless Functions, and CDN availability.
Click on "Deploy Server".
Wait a few minutes for the server to deploy. Once ready, it will show a "Started" state.
In the chat, type @ followed by the MCP server name and your instructions, e.g., "@Status Observer MCP check the status of GitHub and OpenAI"
That's it! The server will respond to your query, and you can continue using it as needed.
Here is a step-by-step guide with screenshots.
This project is continuously updated with new platform integrations. If you're not seeing a service that should be available, or if Claude doesn't recognize a platform, please update by runningnpm run build from a freshly cloned repository.
Last updated: 2026-09-26 — every platform is now read directly from its vendor's official status API. The intermediate helper service the previous version relied on has been retired, and OpenRouter and X were removed because neither exposes a status API reachable from a server (OpenRouter's returns 403 to non-browser clients; X no longer publishes one).
Monitor world's most used digital platforms (GitHub, Slack, Discord, etc.)
Track AI providers including OpenAI, Anthropic (Claude), and Gemini
Get detailed status information for specific services with incident history
Check status of specific components within each platform
Real-time updates of service status with impact analysis
Comprehensive incident tracking with resolution status and timelines
Simple query interface with commands like status --github (the -- prefix is optional)
Related MCP server: mcp-rss-aggregator
Click on any timestamp to jump to that section of the video
00:00 - LinkedIn Platform Status Assessment
Comprehensive analysis of LinkedIn's operational health, including detailed examination of core services such as LinkedIn.com, LinkedIn Learning, Campaign Manager, Sales Navigator, Recruiter, and Talent solutions. All systems confirmed fully operational with zero service disruptions.
00:20 - GitHub Infrastructure Status Overview
Detailed evaluation of GitHub's service availability, covering critical components including Git operations, API requests, Actions, Webhooks, Issues, Pull Requests, Packages, Pages, Codespaces, and Copilot functionality. Complete operational status confirmed across all GitHub services.
00:40 - Vercel Platform Reliability Analysis
In-depth examination of Vercel's global edge network and deployment infrastructure, featuring comprehensive status reporting on core services such as API, Dashboard, Builds, Serverless Functions, Edge Functions, and global CDN locations. All Vercel services verified operational across all regions.
01:08 - Cloudflare Network Status Examination
Extensive analysis of Cloudflare's global infrastructure status, detailing service availability across geographic regions and specific service components. Identified performance degradation in multiple regions (Africa, Asia, Europe, Latin America, Middle East, North America) while core services remain functional. Includes detailed assessment of regional data centers under maintenance and technical impact analysis.
01:46 - Global Operational Status Report
Consolidated overview of operational status across all major technology platforms and service providers, highlighting both fully operational services (GitHub, Vercel, Netlify, Asana, Atlassian, etc.) and services experiencing degraded performance (Cloudflare, Twilio). Includes strategic recommendations for organizations with dependencies on affected services.
Node.js 20 or higher
Claude Desktop
Internet connection to access status APIs
Install the packaged bundle from the Smithery server page, or from the CLI:
npx -y @smithery/cli@latest mcp add imprvhub/mcp-status-observer --client claudeClone or download this repository:
git clone https://github.com/imprvhub/mcp-status-observer
cd mcp-status-observer
Install dependencies:
npm installBuild the project:
npm run buildThere are two ways to run the MCP server:
Open a terminal or command prompt
Navigate to the project directory
Run the server directly:
node build/index.jsKeep this terminal window open while using Claude Desktop. The server will run until you close the terminal.
The Claude Desktop can automatically start the MCP server when needed. To set this up:
The Claude Desktop configuration file is located at:
macOS: ~/Library/Application Support/Claude/claude_desktop_config.json
Windows: %APPDATA%\Claude\claude_desktop_config.json
Linux: ~/.config/Claude/claude_desktop_config.json
Edit this file to add the Status Observer MCP configuration. If the file doesn't exist, create it:
{
  "mcpServers": {
    "statusObserver": {
      "command": "node",
      "args": ["ABSOLUTE_PATH_TO_DIRECTORY/mcp-status-observer/build/index.js"]
    }
  }
}Important: Replace ABSOLUTE_PATH_TO_DIRECTORY with the complete absolute path where you installed the MCP
macOS/Linux example: /Users/username/mcp-status-observer
Windows example: C:\\Users\\username\\mcp-status-observer
If you already have other MCPs configured, simply add the "statusObserver" section inside the "mcpServers" object. Here's an example of a configuration with multiple MCPs:
{
  "mcpServers": {
    "otherMcp1": {
      "command": "...",
      "args": ["..."]
    },
    "otherMcp2": {
      "command": "...",
      "args": ["..."]
    },
    "statusObserver": {
      "command": "node",
      "args": [
        "ABSOLUTE_PATH_TO_DIRECTORY/mcp-status-observer/build/index.js"
      ]
    }
  }
}
The MCP server will automatically start when Claude Desktop needs it, based on the configuration in your claude_desktop_config.json file.
Restart Claude Desktop after modifying the configuration
In Claude, use the status command to interact with the Status Observer MCP Server
The MCP server runs as a subprocess managed by Claude Desktop
The Status Observer MCP provides a single tool named status with several commands:
Command | Description | Parameters | Example |
| List all available platforms | None |
|
| Get status for a specific platform | Platform id |
|
| Get status for all platforms | None |
|
The Status Observer monitors 21 major digital platforms, each read from that vendor's own status API:
OpenAI - Leading AI services provider (ChatGPT, DALL-E, API)
Anthropic (Claude) - AI assistant provider
Gemini / Vertex AI - Google's multimodal AI platform, reported through Google Cloud incidents
Google Cloud Platform - Comprehensive cloud computing services
DigitalOcean - Developer-focused cloud infrastructure
Vercel - Frontend deployment and edge platform
Netlify - Web development and deployment platform
Docker - Container platform and services
GitHub - Version control and collaboration platform
npm - JavaScript package manager and registry
Atlassian - Developer collaboration tools (Jira, Bitbucket, Confluence)
Supabase - Open source backend platform (PostgreSQL, auth, storage)
LinkedIn - Professional networking platform
Slack - Business communication and collaboration
Asana - Team workflow and project management
Dropbox - Cloud file storage and collaboration
Cloudflare - Web infrastructure, CDN, and security
Discord - Developer community and communication platform
Reddit - Social news and developer community platform
Amplitude - Product analytics platform
Here are various examples of how to use the Status Observer with Claude:
# AI Platforms
status --openai
status --anthropic
status --gemini

# Cloud Infrastructure
status --gcp
status --vercel
status --digitalocean
status --netlify

# Developer Tools
status --docker
status --github
status --atlassian
status --supabase
status --npm

# Productivity & Social
status --linkedin
status --slack
status --dropbox

# Web Infrastructure
status --cloudflare
status --discord

# All platforms
status --all
status list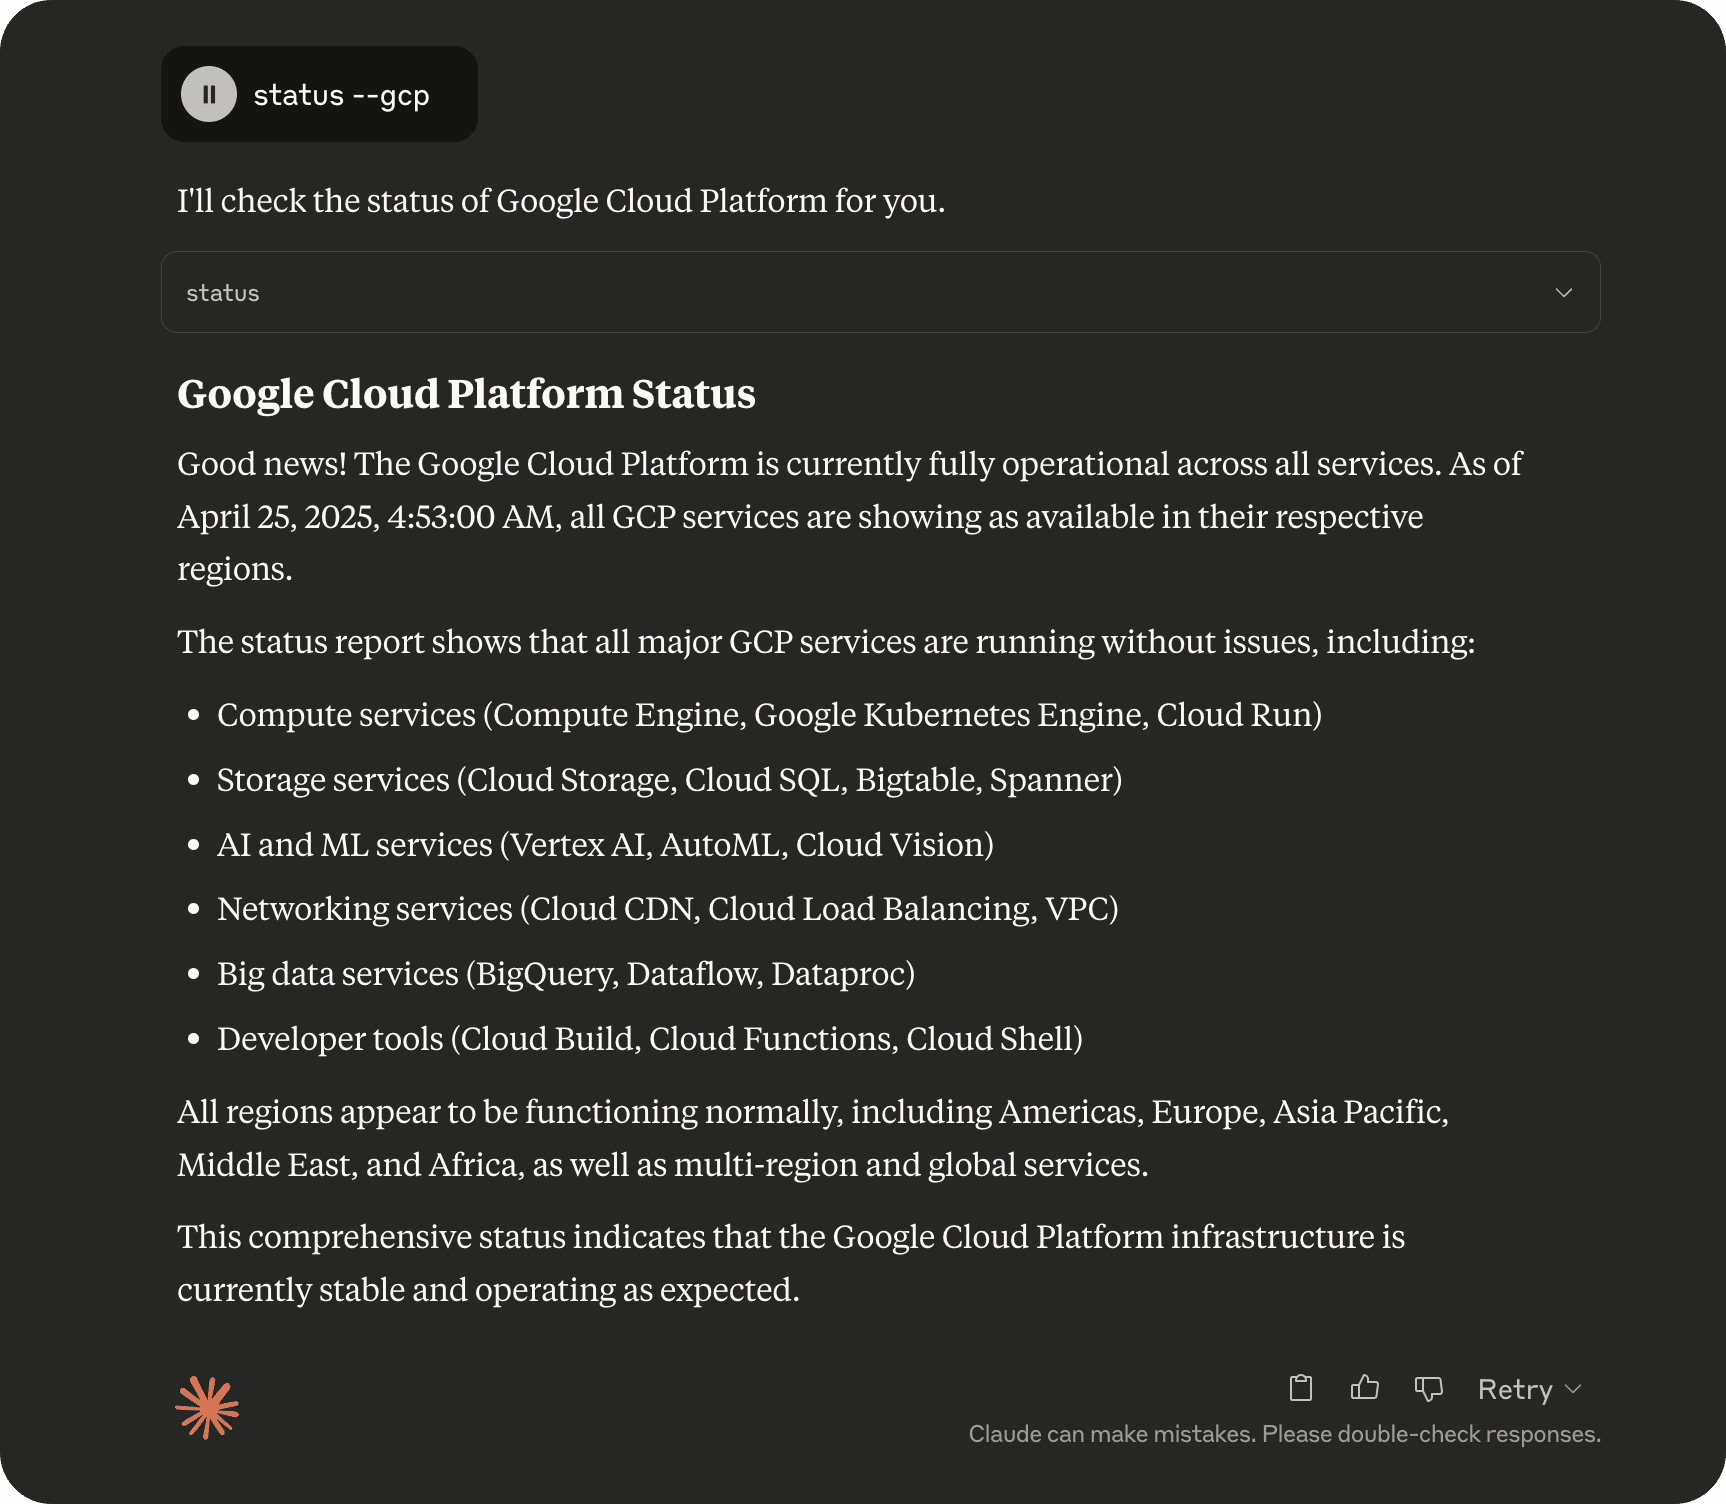
You can also interact with the MCP using natural language. Claude will interpret these requests and use the appropriate commands:
"Could you check if OpenAI is having any API issues right now?"
"What's the status of OpenAI's ChatGPT service?"
"Has there been any recent incidents with Claude or the Anthropic API?"
"Is Google Cloud Platform experiencing any outages in my region?"
"Check if Docker Hub is operational for automated builds"
"What's the current status of LinkedIn's Sales Navigator?"
"Can you tell me if Google's Gemini AI is experiencing any service disruptions?"
"Show me the status of all AI platforms including Anthropic and OpenAI"
"Are there any active incidents affecting GitHub Actions or Git operations?"
"Check the overall health of Vercel and Netlify for my deployment pipeline"
"Has Supabase had any recent database or authentication issues?"
"What's the status of all major platforms right now?"
Run the test suite (no network required):
npm install
npm run build
npm testIf you see the error "MCP Status Observer: Server disconnected" in Claude Desktop:
Verify the server is running:
Open a terminal and manually run node build/index.js from the project directory
If the server starts successfully, use Claude while keeping this terminal open
Check your configuration:
Ensure the absolute path in claude_desktop_config.json is correct for your system
Double-check that you've used double backslashes (\\) for Windows paths
Verify you're using the complete path from the root of your filesystem
If the Status Observer tools don't appear in Claude:
Make sure you've restarted Claude Desktop after configuration
Check the Claude Desktop logs for any MCP communication errors
Ensure the MCP server process is running (run it manually to confirm)
Verify that the MCP server is correctly registered in the Claude Desktop MCP registry
To check if the server is running:
Windows: Open Task Manager, go to the "Details" tab, and look for "node.exe"
macOS/Linux: Open Terminal and run ps aux | grep node
If you don't see the server running, start it manually or use the auto-start method.
Contributors can easily add support for additional platforms by modifying the initializePlatforms method in src/index.ts. The process is straightforward:
Identify a platform's status API endpoint
Most vendors publish an Atlassian Statuspage, whose /api/v2/summary.json shape is
already handled. Adding one is a single line in the STATUSPAGE table — the origin only,
the path is appended for you:
['newservice', 'New Service', 'Description of the service', 'https://status.newservice.com'],That is the whole change: the generic renderer reports overall status, any non-operational components, active incidents and scheduled maintenance.
Two shapes are special-cased because they are not Statuspage: Slack's api/v2.0.0/current
and Google Cloud's incidents.json. If a vendor publishes something else again:
Add a value to the ApiKind union
Add a render<Kind>() method returning formatted text
Add the matching case in getPlatformStatus() and getQuickPlatformStatus()
Prefer an official vendor endpoint. An earlier version of this server proxied several platforms through a hosted helper that scraped their HTML status pages; when that helper went offline, ten platforms silently broke. Scraped or proxied sources are not accepted here.
When adding new platforms, consider organizing them into logical categories:
AI/ML: OpenAI, Anthropic, Gemini
Cloud Infrastructure: GCP, AWS, Azure, DigitalOcean
Developer Tools: GitHub, GitLab, Docker, npm
Productivity: Slack, Microsoft 365, Google Workspace
Web Infrastructure: Cloudflare, Fastly, Akamai
This project is licensed under the Mozilla Public License 2.0 - see the LICENSE file for details.
2026-09-26: Every platform now reads its vendor's official status API. Retired the hosted helper service that had gone offline, taking 10 platforms with it (Anthropic, OpenAI, Docker, Atlassian, Supabase, LinkedIn, GCP, Gemini, OpenRouter, X). Eight were restored against official endpoints; OpenRouter and X were removed for lack of a server-reachable status API. Component output now names only what is not operational instead of listing every component, and active incidents and scheduled maintenance are reported. Dependencies updated and the build fixed (it no longer compiled against current MCP SDK releases).
2025-09-12: Added OpenRouter integration with RSS incident tracking and detailed impact analysis
2025-04-26: Added Docker status integration with comprehensive component monitoring
2025-03-15: Enhanced GCP regional status reporting with incident correlation
2025-02-28: Added Anthropic and Gemini AI platform monitoring
2025-01-20: Initial release with core platform support (GitHub, Vercel, Cloudflare, etc.)
Built for the developer community by imprvhub
Check the operational status of major digital platforms, read from each vendor's official status API. Covers AI providers (Anthropic, OpenAI, Gemini), clouds (GCP, Cloudflare, DigitalOcean, Vercel, Netlify, Supabase) and developer or workplace tools (GitHub, Docker, npm, Slack, Atlassian, Discord, Dropbox, Twilio, Asana, Reddit, LinkedIn, Amplitude).
| Name | Required | Description | Default |
|---|---|---|---|
| command | Yes | 'list' to see every supported platform, 'all' for a one-line summary of each, or a platform id such as 'github', 'anthropic' or 'gcp'. A leading '--' is accepted too (e.g. '--github'). |
Does the description disclose side effects, auth requirements, rate limits, or destructive behavior?
No annotations are provided, so the description carries the full burden. It discloses a meaningful behavioral trait — data is read from each vendor's official status API, implying live external reads rather than cached/local data — but says nothing about rate limits, authentication, latency, caching, or failure behavior when a vendor API is unreachable.
Agents need to know what a tool does to the world before calling it. Descriptions should go beyond structured annotations to explain consequences.
Is the description appropriately sized, front-loaded, and free of redundancy?
Two sentences, front-loaded with the purpose before the coverage list. The long provider enumeration is justified because no enums exist in the schema, though it is dense enough to slightly dilute the core statement.
Shorter descriptions cost fewer tokens and are easier for agents to parse. Every sentence should earn its place.
Given the tool's complexity, does the description cover enough for an agent to succeed on first attempt?
For a single-parameter read tool with no output schema, the description is nearly sufficient: purpose, data source, and valid platform values are all covered. The one gap is that it never hints at the shape of the returned status information (e.g., per-platform status codes), leaving the agent to discover it empirically.
Complex tools with many parameters or behaviors need more documentation. Simple tools need less. This dimension scales expectations accordingly.
Does the description clarify parameter syntax, constraints, interactions, or defaults beyond what the schema provides?
Schema coverage is 100% and already documents 'list', 'all', and platform ids, so the baseline is 3. The description adds value beyond the schema by enumerating the concrete platform identifiers (github, anthropic, gcp, etc.), which compensates for the absence of any enum constraint on the command parameter.
Input schemas describe structure but not intent. Descriptions should explain non-obvious parameter relationships and valid value ranges.
Does the description clearly state what the tool does and how it differs from similar tools?
States a specific verb ('Check') and resource ('operational status of major digital platforms') and clarifies the data source ('each vendor's official status API'). The enumeration of covered providers makes the scope unambiguous even though no sibling tools exist to differentiate from.
Agents choose between tools based on descriptions. A clear purpose with a specific verb and resource helps agents select the right tool.
Does the description explain when to use this tool, when not to, or what alternatives exist?
Implies its use case (checking platform status) but offers no explicit when-to-use/when-not guidance or prerequisites. With no sibling tools, there is little to route against, so the omission is less costly, but the description still never says under what circumstances an agent should reach for this tool.
Agents often have multiple tools that could apply. Explicit usage guidance like "use X instead of Y when Z" prevents misuse.
Recent tool additions, removals, and schema changes observed during successful MCP inspections.
v0.8.0status1 field changedInput schema / properties / command / descriptionPrevious value: -"Command to execute (list, --all, or platform with -- prefix like --github)"New value: +"'list' to see every supported platform, 'all' for a one-line summary of each, or a platform id such as 'github', 'anthropic' or 'gcp'. A leading '--' is accepted too (e.g. '--github')."v1.0.0statusScored across 1 tool
With only a single tool, there is no possibility of confusion or misselection between tools. The one tool's purpose is unambiguous.
The lone tool 'status' is a simple, readable noun name. There is no naming pattern to violate, though it does not follow a verb_noun convention.
A single tool for a status-checking service is thin but arguably sufficient since it is a read-only fetch. It covers many vendors under one operation, making the surface borderline minimal.
The tool covers a broad set of vendors' status APIs, fulfilling the core domain purpose. However, it lacks operations for filtering by vendor, incident history, or per-service detail, which are minor gaps.
Uptime, SSL, DNS and domain monitoring you can talk to from Claude or any MCP client.
Model Context Protocol server for Studex tools, notifications, and profile integrations
A Model Context Protocol server for Wix AI tools
A comprehensive Model Context Protocol (MCP) server that enables AI assistants to interact with yo…