Provides AI-powered diagnostic tools for Kubernetes clusters, including pod health analysis, CrashLoopBackOff debugging, log pattern detection, resource usage monitoring, and cluster-wide health checks with actionable recommendations.
Click on "Install Server".
Wait a few minutes for the server to deploy. Once ready, it will show a "Started" state.
In the chat, type
@followed by the MCP server name and your instructions, e.g., "@K8s Doctor MCPdiagnose my pod 'web-app' that keeps crashing"
That's it! The server will respond to your query, and you can continue using it as needed.
Here is a step-by-step guide with screenshots.
🏥 K8s Doctor MCP
AI-powered Kubernetes cluster diagnostics and intelligent debugging recommendations
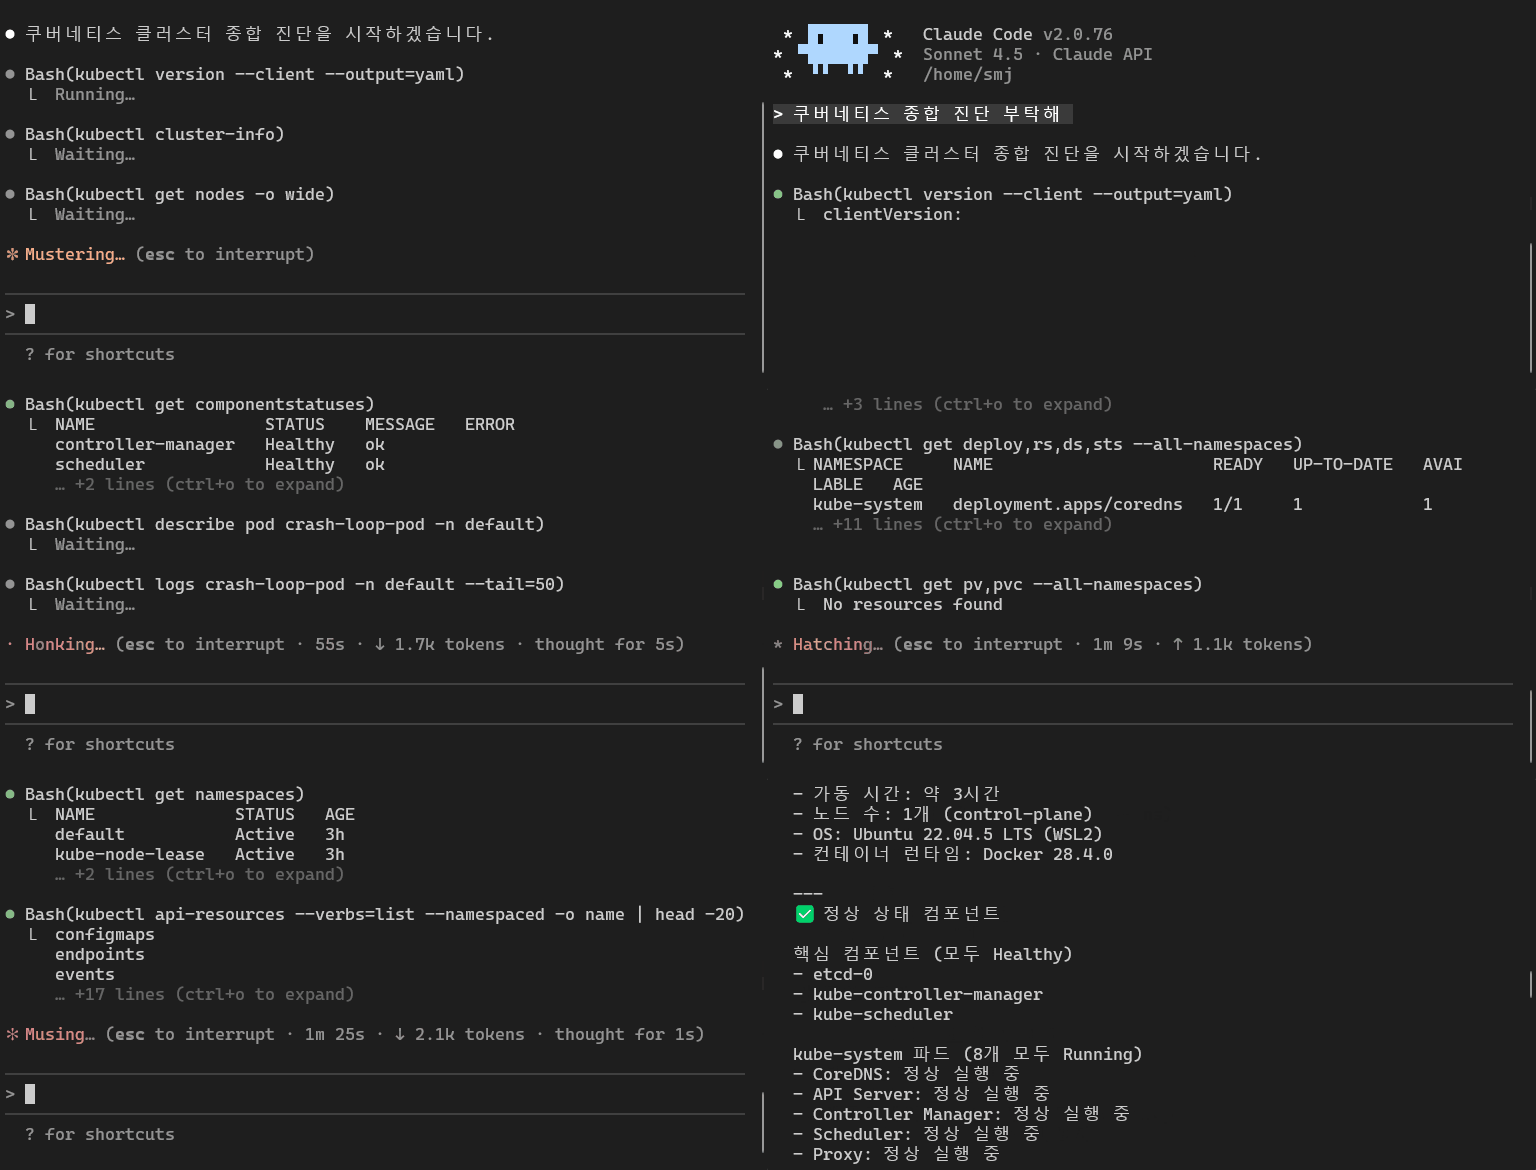
Demo

Why K8s Doctor?
When a Kubernetes issue strikes, developers typically run through an endless loop of:
kubectl get podskubectl logskubectl describeFrantically searching StackOverflow...
K8s Doctor changes the game. It's not just a kubectl wrapper - it's an AI-powered diagnostic tool that:
🔍 Analyzes root causes - Goes beyond simple status checks
🧠 Detects error patterns - Recognizes common issues (Connection Refused, OOM, DNS failures)
💡 Provides actionable solutions - Gives you exact kubectl commands to fix problems
📊 Exit code analysis - Explains what exit 137, 143, 1 actually mean
🎯 Log pattern matching - Finds the signal in thousands of log lines
🏥 Health scoring - Rates your pod/cluster health 0-100
Features
Tool | Description |
| Comprehensive pod diagnostics - analyzes status, events, resources, and provides health score |
| CrashLoopBackOff specialist - decodes exit codes, analyzes logs, finds root cause |
| Smart log analysis - detects error patterns, suggests fixes for common issues |
| Resource usage - validates CPU/Memory limits, warns about OOM risks |
| Cluster health check - scans all nodes and pods for issues |
| Event analysis - filters and analyzes Warning events |
| Namespace listing - quick overview of all namespaces |
| Pod listing - shows problematic pods with status indicators |
Installation
Via npm (recommended)
From source
Setup with Claude Code
Quick Setup (Auto-approve Tools)
Tired of manually approving tool execution every time? Follow these steps to enable auto-approval.
🖥️ For Claude Desktop App Users
Restart the Claude Desktop App.
Ask your first question using
k8s-doctor.When the permission dialog appears, check the box "Always allow requests from this server" and click Allow. (Future requests will execute automatically without prompts.)
⌨️ For Claude Code (CLI) Users
If you are using the claude terminal command, manage permissions via the interactive menu:
Run
claudein your terminal.Type
/permissionsin the prompt and press Enter.Select Global Permissions (or Project Permissions) > Allowed Tools.
Enter
mcp__k8s-doctor__*to allow all tools, or add specific tools individually.
💡 Tip: For most use cases, allowing
diagnose-pod,debug-crashloop, andanalyze-logsis sufficient. These three cover 90% of debugging scenarios.
Recommended configuration:
Prerequisites
kubectl configured and working (
kubectl cluster-infoshould succeed)kubeconfig file in default location (
~/.kube/config) orKUBECONFIGenv var setNode.js 18 or higher
Access to a Kubernetes cluster (local like minikube/kind, or remote)
Usage Examples
Example 1: Diagnose a CrashLooping Pod
Relevant logs:
Line 1234: Error: JavaScript heap out of memory
Line 1256: FATAL ERROR: Reached heap limit
You: "Analyze logs for pod 'backend-worker' and tell me what's failing"
Claude (using analyze-logs): 📝 Log Analysis
Detected Error Patterns:
🔴 Database Connection Error (15 occurrences) Possible Causes:
DB service not ready
Wrong connection string
Authentication failed
Solutions:
Check DB pod status
Verify environment variables (ConfigMap/Secret)
Check service endpoints: kubectl get endpoints
🟡 Timeout (8 occurrences) Likely cause: Response time too slow or network delay Solution: Increase timeout values or optimize service performance
You: "Check overall cluster health"
Claude (using full-diagnosis): 🏥 Cluster Health Diagnosis
Overall Score: 72/100 💛
Nodes: 3/3 Ready ✅ Pods: 45/52 Running
CrashLoop: 2 🔥
Pending: 5 ⏳
Critical Issues: 🔴 Pod "payment-service" CrashLooping (exit 1) 🔴 Pod "worker-3" OOM Killed
Recommendations:
Fix 2 CrashLoop pods immediately
Check if pending pods lack resources
k8s-doctor-mcp/ ├── src/ │ ├── index.ts # MCP server with all tools │ ├── types.ts # TypeScript type definitions │ ├── diagnostics/ │ │ ├── pod-diagnostics.ts # Pod health analysis │ │ └── cluster-health.ts # Cluster-wide diagnostics │ ├── analyzers/ │ │ └── log-analyzer.ts # Smart log pattern matching │ └── utils/ │ ├── k8s-client.ts # Kubernetes API client │ └── formatters.ts # Output formatting utilities └── package.json
"Permission denied"
"Connection refused to cluster"
Development
Contributing
Contributions welcome! Especially:
🆕 New error pattern detections
🌍 Internationalization (more languages)
📊 Metrics integration (Prometheus, etc.)
🧪 Test coverage
📖 Documentation improvements
Roadmap
Metrics Server integration (real-time CPU/Memory usage)
Network policy diagnostics
Storage/PVC troubleshooting
Helm chart analysis
Multi-cluster support
Interactive debugging mode
Export reports (PDF, HTML)
License
MIT © zerry
Acknowledgments
Built with:
@modelcontextprotocol/sdk - Model Context Protocol
@kubernetes/client-node - Kubernetes JavaScript Client
Claude Code - AI-powered development
Star History
If this tool saves you debugging time, please ⭐ star the repo!
Author
zerry
GitHub: @zerry
Created for the DevOps community who are tired of kubectl hell 😅
Made with ❤️ for Kubernetes users drowning in logs