
Works alongside the broader ELK Stack, providing diagnostics and monitoring capabilities that complement Elastic's ecosystem for log management and analysis.
Supports integration with Elasticsearch clusters, helping monitor Logstash performance feeding into Elasticsearch, identify pipeline bottlenecks that may affect indexing, and optimize configurations for better cluster performance.
Provides tools for monitoring and diagnosing Logstash instances, including connectivity checks, node statistics, pipeline performance analysis, health assessments, plugin management, and JVM metrics visualization.
Click on "Install Server".
Wait a few minutes for the server to deploy. Once ready, it will show a "Started" state.
In the chat, type
@followed by the MCP server name and your instructions, e.g., "@Logstash MCP Servercheck the health of my Logstash instance"
That's it! The server will respond to your query, and you can continue using it as needed.
Here is a step-by-step guide with screenshots.
IMPORTANT
This repository is vibe coded, AI generated and not tested properly. Use it with your own risk.
Logstash MCP Server
A Model Context Protocol (MCP) server for interacting with Logstash instances. This server provides comprehensive tools for monitoring and defining Logstash instance performance bottleneck.
Web UI
The project includes a web-based user interface for easy interaction with your Logstash instance.
Running the Web UI
Start the web interface:
Open your browser and navigate to:
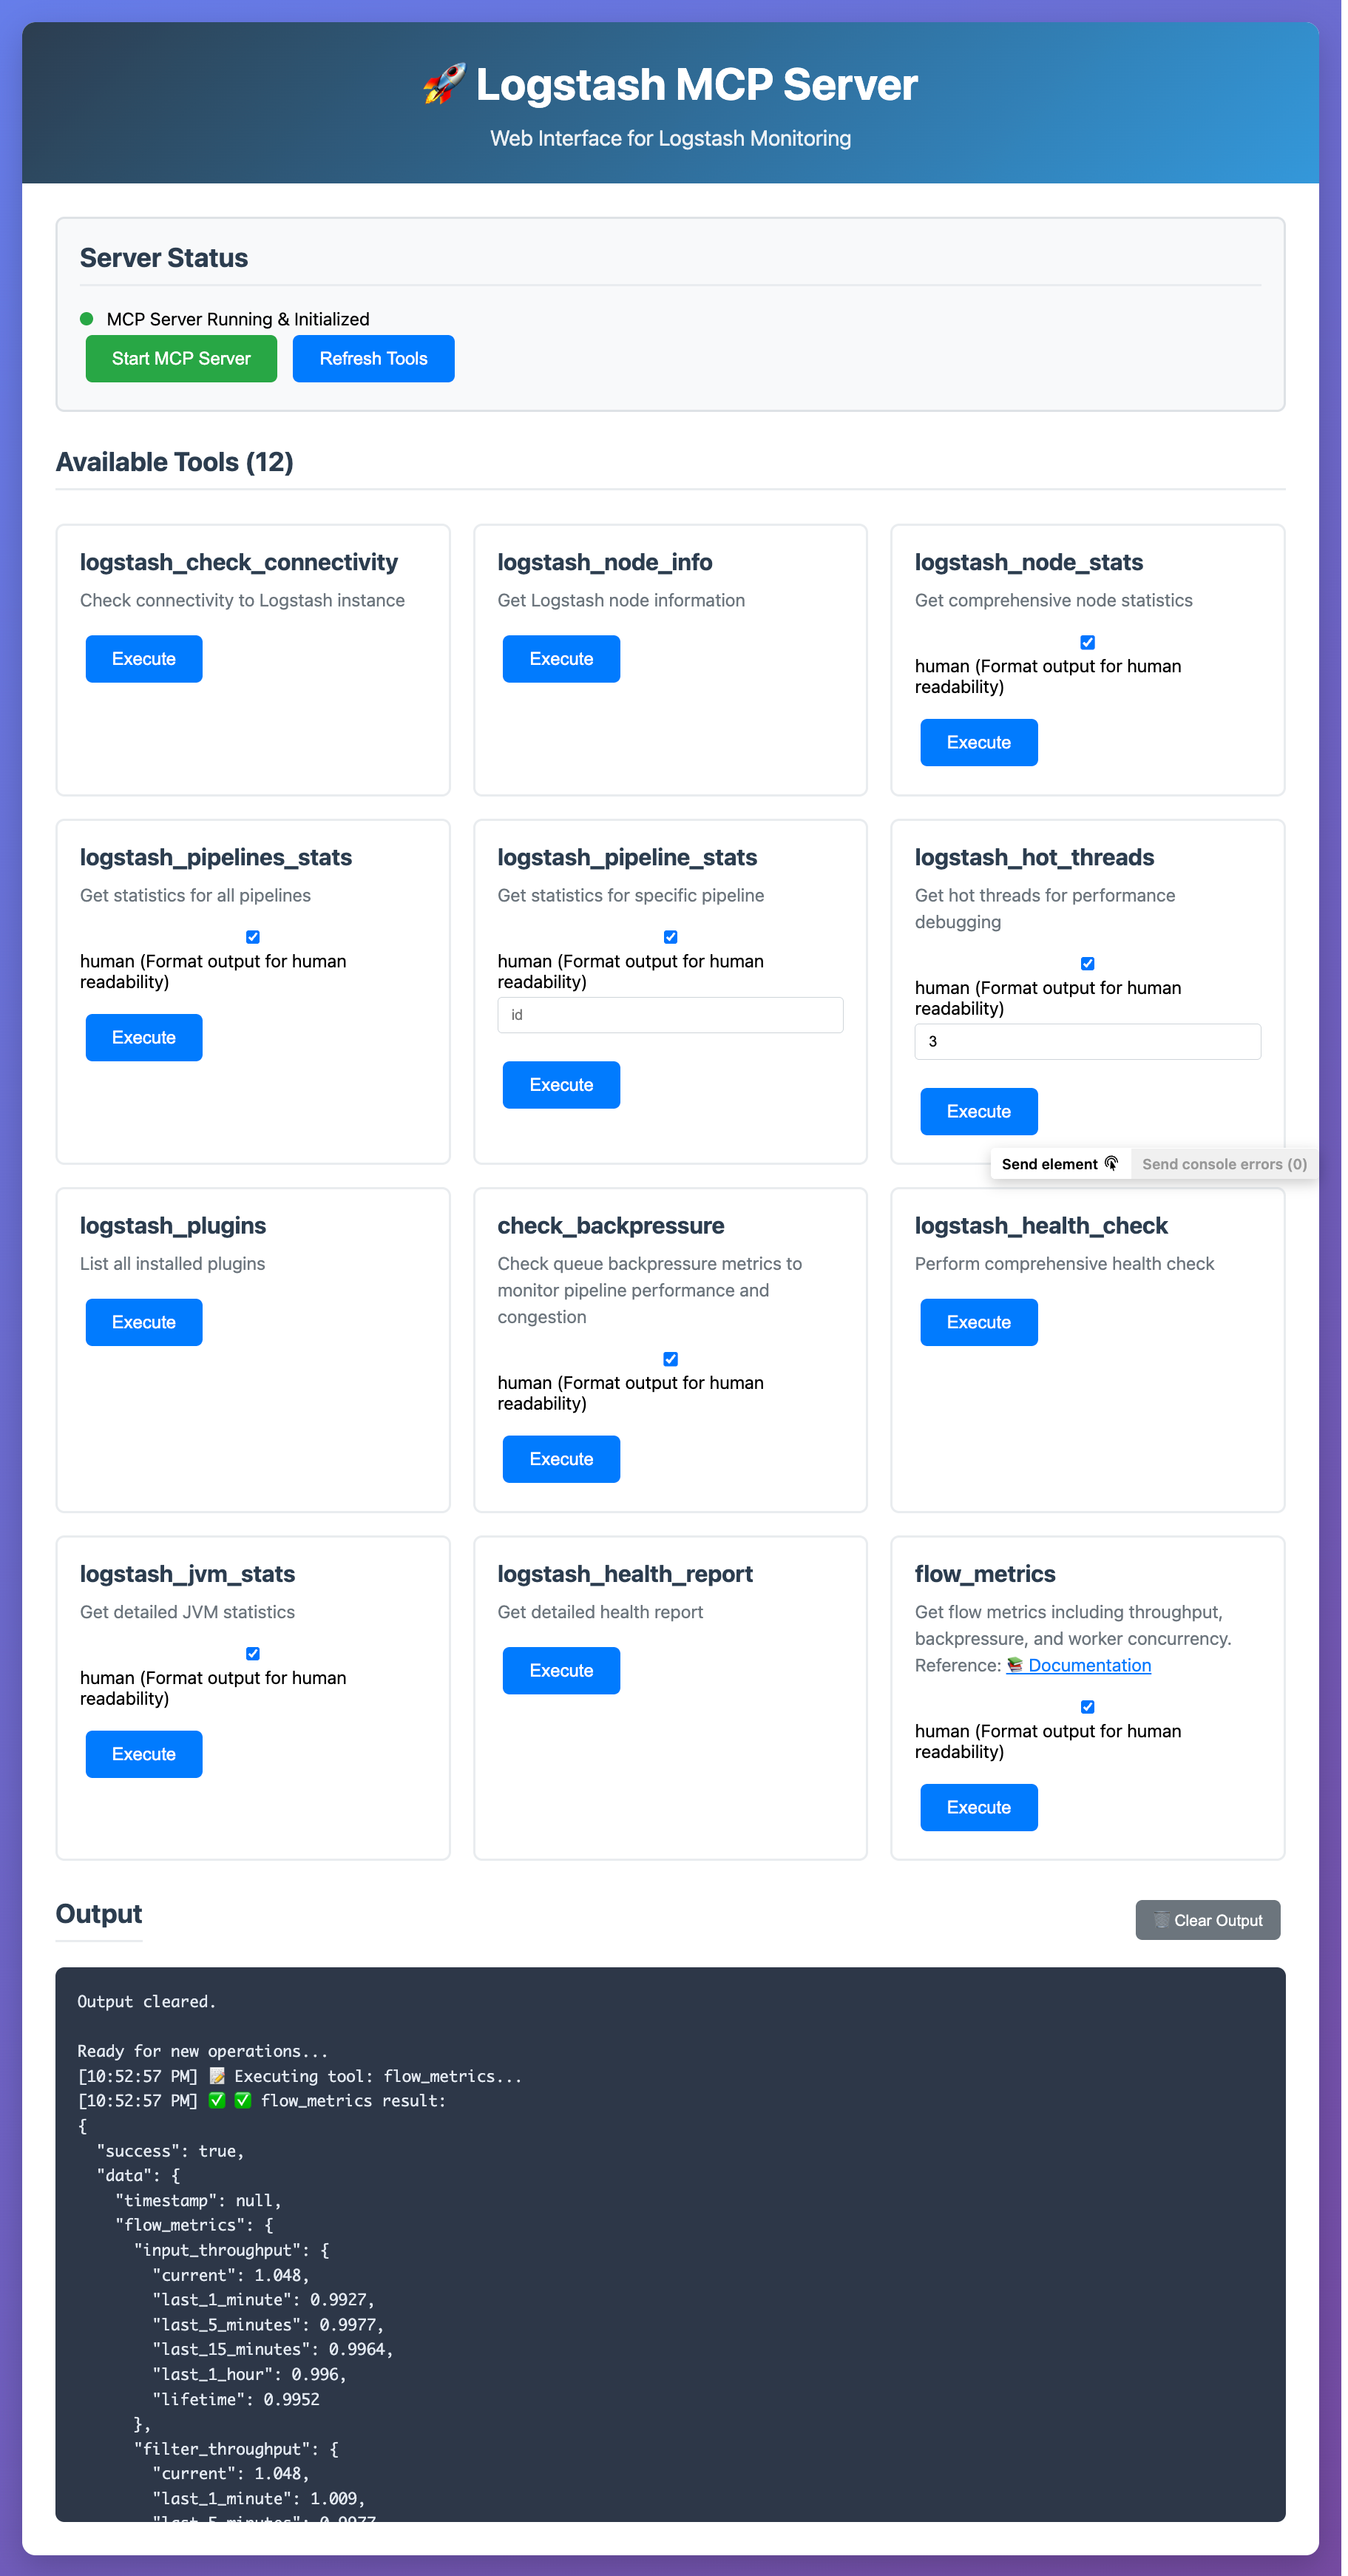
Web UI Features
The web interface provides:
Interactive Dashboard: Visual interface to access all Logstash monitoring tools
Real-time Monitoring: Check connectivity, node stats, and pipeline performance
Health Analysis: Comprehensive health checks with visual feedback
Pipeline Management: View statistics for individual or all pipelines
Performance Debugging: Hot threads analysis and JVM statistics
Plugin Management: Browse installed Logstash plugins
Web UI Configuration
The web UI uses the same configuration as the MCP server:
Default Logstash URL:
http://localhost:9600Override with:
LOGSTASH_API_BASEenvironment variableWeb interface runs on:
http://localhost:5001
Example with custom Logstash URL:
Related MCP server: Logfire MCP Server
Features
Monitoring Tools
Node Information: Get Logstash version, build info, and settings
Node Statistics: JVM, process, and pipeline metrics
Pipeline Statistics: Monitor individual or all pipeline performance
Hot Threads: Debug performance issues with thread analysis
Health Check: Comprehensive health assessment with recommendations
Connectivity Check: Verify connection to Logstash with detailed diagnostics
Management Tools
Pipeline Reload: Reload specific pipeline configurations
Plugin Listing: View all installed Logstash plugins
JVM Statistics: Detailed memory and garbage collection metrics
Grok Patterns: List available Grok patterns for log parsing
Installation
Install dependencies:
Set up environment variables (optional):
Configuration
The server uses the following default configuration:
Logstash Host: localhost
Logstash Port: 9600
API Base URL: http://localhost:9600
You can override the API base URL using the LOGSTASH_API_BASE environment variable.
Available Tools (12 Total)
logstash_check_connectivity
Check connectivity to the Logstash instance with detailed connection status, response times, and error handling.
Returns: Connection status, URL, version, host, response time, error details, and troubleshooting suggestions
logstash_node_info
Get Logstash node information including version, build info, and settings.
logstash_node_stats
Get comprehensive node statistics including JVM, process, and pipeline metrics.
Parameters:
human(boolean, default: true)
logstash_pipelines_stats
Get statistics for all Logstash pipelines.
Parameters:
human(boolean, default: true)
logstash_pipeline_stats
Get statistics for a specific pipeline.
Parameters:
id(string, required),human(boolean, default: true)
logstash_hot_threads
Get hot threads information for debugging performance issues.
Parameters:
threads(integer, default: 3),human(boolean, default: true)
logstash_plugins
List all installed Logstash plugins.
check_backpressure
Check queue backpressure metrics to monitor pipeline performance and congestion.
Parameters:
human(boolean, default: true)
logstash_health_check
Perform comprehensive health check with analysis and recommendations.
logstash_jvm_stats
Get detailed JVM statistics for memory analysis.
Parameters:
human(boolean, default: true)
logstash_health_report
Get detailed health report from Logstash.
flow_metrics
Get detailed flow metrics including throughput, backpressure, and worker concurrency.
Parameters:
human(boolean, default: true)
Health Check Analysis
The health check tool analyzes:
Connectivity Verification: Tests connection to Logstash before other checks
JVM Memory Usage: Warns if heap usage exceeds 80%
Pipeline Performance: Detects pipelines with filtered but no output events
Queue Usage: Identifies large queue sizes that may impact performance
Quick Start Commands
After starting the server with python3 logstash_mcp_server.py, use these JSON-RPC commands:
1. Initialize (Required First)
2. Check Connectivity
3. Health Check
4. List All Tools
5. Get Node Info
Usage Examples
Basic Health Check
Pipeline Monitoring
Performance Debugging
Integration with ELK Stack
This MCP server is designed to work alongside Elasticsearch diagnostics and can help:
Monitor Logstash performance feeding into your Elasticsearch cluster
Identify pipeline bottlenecks that may contribute to indexing delays
Optimize Logstash configuration for better cluster performance
Based on your Elasticsearch cluster analysis showing high shard counts, ensure your Logstash pipelines are optimized for efficient indexing patterns.
Error Handling
The server includes comprehensive error handling for:
Connection failures to Logstash API
Invalid pipeline IDs
API response errors
Network timeouts
Detailed error messages with troubleshooting suggestions
Testing
Run the test suite to verify everything works:
The test suite includes:
Server initialization tests
Tool listing verification
Mocked health check tests
Error handling validation
Security Considerations
The server connects to Logstash API endpoints
Ensure proper network security between MCP server and Logstash
Consider authentication if your Logstash instance requires it
Monitor API access logs for security auditing