Glama

Fermat MCP

This project provides a FastMCP server for mathematical computations, including numerical and symbolic calculations, as well as plotting.

Modules

1. mpl_mcp - Matplotlib Integration

Feature

Description

plot_barchart

Plots bar charts of given data values

plot_scatter

Creates scatter plots from data points

plot_chart

Plots line, scatter, or bar charts

plot_stem

Creates stem plots for discrete data

plot_stack

Generates stacked area/bar charts

eqn_chart

Plots mathematical equations

2. numpy_mcp - NumPy Integration

Category

Operations

Basic Math

add, sub, mul, div, power, abs, exp, log, sqrt

Trigonometric

sin, cos, tan

Statistics

mean, median, std, var, min, max, argmin, argmax, percentile

Linear Algebra

dot, matmul, inv, det, eig, solve, svd

Matrix Operations

create, zeros, ones, full, arange, linspace

Array Manipulation

reshape, flatten, concatenate, transpose, stack

3. sympy_mcp - SymPy Integration

Category

Operations

Algebra

simplify, expand, factor, collect

Calculus

diff, integrate, limit, series

Equations

solve, solveset, linsolve, nonlinsolve

Matrix Operations

create, det, inv, rref, eigenvals

Related MCP server: mcp-sympy

Setup

Requirements

Clone the repository

git clone https://github.com/abhiphile/fermat-mcp

Visual Studio Code, Windsurf

You can find the mcp.json file in the MCP: Open User Configuration or MCP: Open Workspace Configuration

vs-code-1

Add the following to your mcp.json:

{
  "mcpServers": {
    "fmcp": {
      "command": "bash",
      "args": ["MCP_SERVER_ABSOLUTE_PATH/setup.sh"],
      "description": "fmcp server is for mathematical computations, including numerical and symbolic calculations, as well as plotting."
    }
  }
}

Claude (Anthropic)

If you're using Claude or the Anthropic MCP client, add this working MCP configuration to your mcp.json (update the directory path to your local clone):

{
  "mcpServers": {
    "fmcp": {
      "command": "uv",
      "args": [
        "--directory",
        "/home/ty/Repositories/fermat-mcp",
        "run",
        "server.py"
      ]
    }
  }
}

Gemini CLI

  • Open your Gemini settings JSON located in ~/.gemini/settings.json where ~ is your home directory.

  • Add the following to your settings.json:

{
  "mcpServers": {
    "fmcp": {
      "command": "bash",
      "args": ["MCP_SERVER_ABSOLUTE_PATH/setup.sh"],
      "description": "fmcp server is for mathematical computations, including numerical and symbolic calculations, as well as plotting."
    }
  }
}

Installing via Smithery

To install Fermat MCP for local usage automatically via Smithery:

npx -y @smithery/cli install @abhiphile/fermat-mcp --client gemini

Example Usage

  • Using Gemini CLI

╭──────────────────────────────────────────────────────────────────────────────────────────────────────────────╮
│  > Can you use fmcp server and using numpy method find the eigen values of this 8*8 matrix,                  |
│    2 1 3 1 1 8 4 2                                                                                           |
│    6 6 0 7 1 4 6 1                                                                                           │
│    9 2 1 8 7 9 9 0                                                                                           │
│    2 5 6 6 9 8 0 1                                                                                           │
│    1 3 6 2 3 8 8 1                                                                                           │
│    9 4 2 2 1 2 2 9                                                                                           │
│    8 6 4 4 2 0 2 8                                                                                           │
│    0 0 0 6 6 7 5 6                                                                                           │
╰──────────────────────────────────────────────────────────────────────────────────────────────────────────────╯

 ╭─────────────────────────────────────────────────────────────────────────────────────────────────────────────────────────────────────────╮
 │ ✔  numpy_mcp_numerical_operation (fmcp MCP Server) {"a":[[2,1,3,1,1,8,4,2],[6,6,0,7,1,4,6,1],[9,2,1,8,7,9,9,0],[2,5,6,6,9,8,0,1],[1,3,… │
 │                                                                                                                                         │
 │    {"eigenvalues":["32.077244457548815+0j","-11.531090644775198+0j","-6.6653982146786195+0j","0.6715984762411508+3.37024850             │
 │    10270413j","0.6715984762411508-3.3702485010270413j","4.541270555490195+2.776364664923869j","4.541270555490195-2.77636466             │
 │    4923869j","3.6935063384423428+0j"],"eigenvectors":[["-0.23263835483680192+0j","-0.2264723575289234+0j","-0.4308391916391             │
 │    0195+0j","-0.012346573390129022+0.17748655663058255j","-0.012346573390129022-0.17748655663058255j","-0.21221572277027187             │
 │    +0.3524396218277479j","-0.21221572277027187-0.3524396218277479j","0.3451499664861578+0j"],["-0.31955742545335186+0j","-0             │
 │    .2569860493445581+0j","0.05691886770041556+0j","-0.35591013681869693-0.2242364092694275j","-0.35591013681869693+0.224236             │
 │    4092694275j","0.1932161673963751-0.39527849111641133j","0.1932161673963751+0.39527849111641133j","-0.7979681696063214+0j             │
 │    "],["-0.46626263247473404+0j","-0.4684914620112376+0j","0.5469400556350749+0j","0.34325164099973565+0.06607019711949293j             │
 │    ","0.34325164099973565-0.06607019711949293j","0.21312270185159682+0.28822307710358636j","0.21312270185159682-0.288223077             │
 │    10358636j","0.42707422750984786+0j"],["-0.41589316441674523+0j","0.2291771012892302+0j","0.09410792992600435+0j","0.6375             │
 │    92441360358+0j","0.637592441360358+-0j","0.46446646137729414+0j","0.46446646137729414+-0j","0.08171661775583623+0j"],["-             │
 │    0.35812884189789035+0j","-0.26551071423139044+0j","-0.649979374400915+0j","-0.2999153430497845+0.20110182336747695j","-0             │
 │    .2999153430497845-0.20110182336747695j","0.04424367733961273-0.020400357434930304j","0.04424367733961273+0.0204003574349             │
 │    30304j","-0.037276545325188024+0j"],["-0.3042416233100104+0j","0.4027405071320744+0j","0.2343447346668298+0j","-0.119224             │
 │    87219398595+0.10317726668781271j","-0.11922487219398595-0.10317726668781271j","-0.3387759141362585+0.15790241128043445j"             │
 │    ,"-0.3387759141362585-0.15790241128043445j","0.11473144194899779+0j"],["-0.35389732755448017+0j","0.5359362131480812+0j"             │
 │    ,"0.13989902586074168+0j","-0.16008513226461316-0.26111873108374495j","-0.16008513226461316+0.26111873108374495j","0.055             │
 │    729749650881726-0.22748184206919145j","0.055729749650881726+0.22748184206919145j","-0.19838514696566653+0j"],["-0.327615             │
 │    5213691367+0j","-0.30122843153433887+0j","0.07858579556736099+0j","0.00042251379361638556-0.11670182367986544j","0.00042             │
 │    251379361638556+0.11670182367986544j","-0.18590228871569267-0.2479130526139182j","-0.18590228871569267+0.247913052613918             │
 │    2j","-0.03374593856285834+0j"]]}                                                                                                     │
 ╰─────────────────────────────────────────────────────────────────────────────────────────────────────────────────────────────────────────╯
✦ Of course, I can do that. Here are the eigenvalues for the given matrix:

  32.077244457548815
  -11.531090644775198
  -6.6653982146786195
  0.6715984762411508 + 3.3702485010270413j
  0.6715984762411508 - 3.3702485010270413j
  4.541270555490195 + 2.776364664923869j
  4.541270555490195 - 2.776364664923869j
  3.6935063384423428
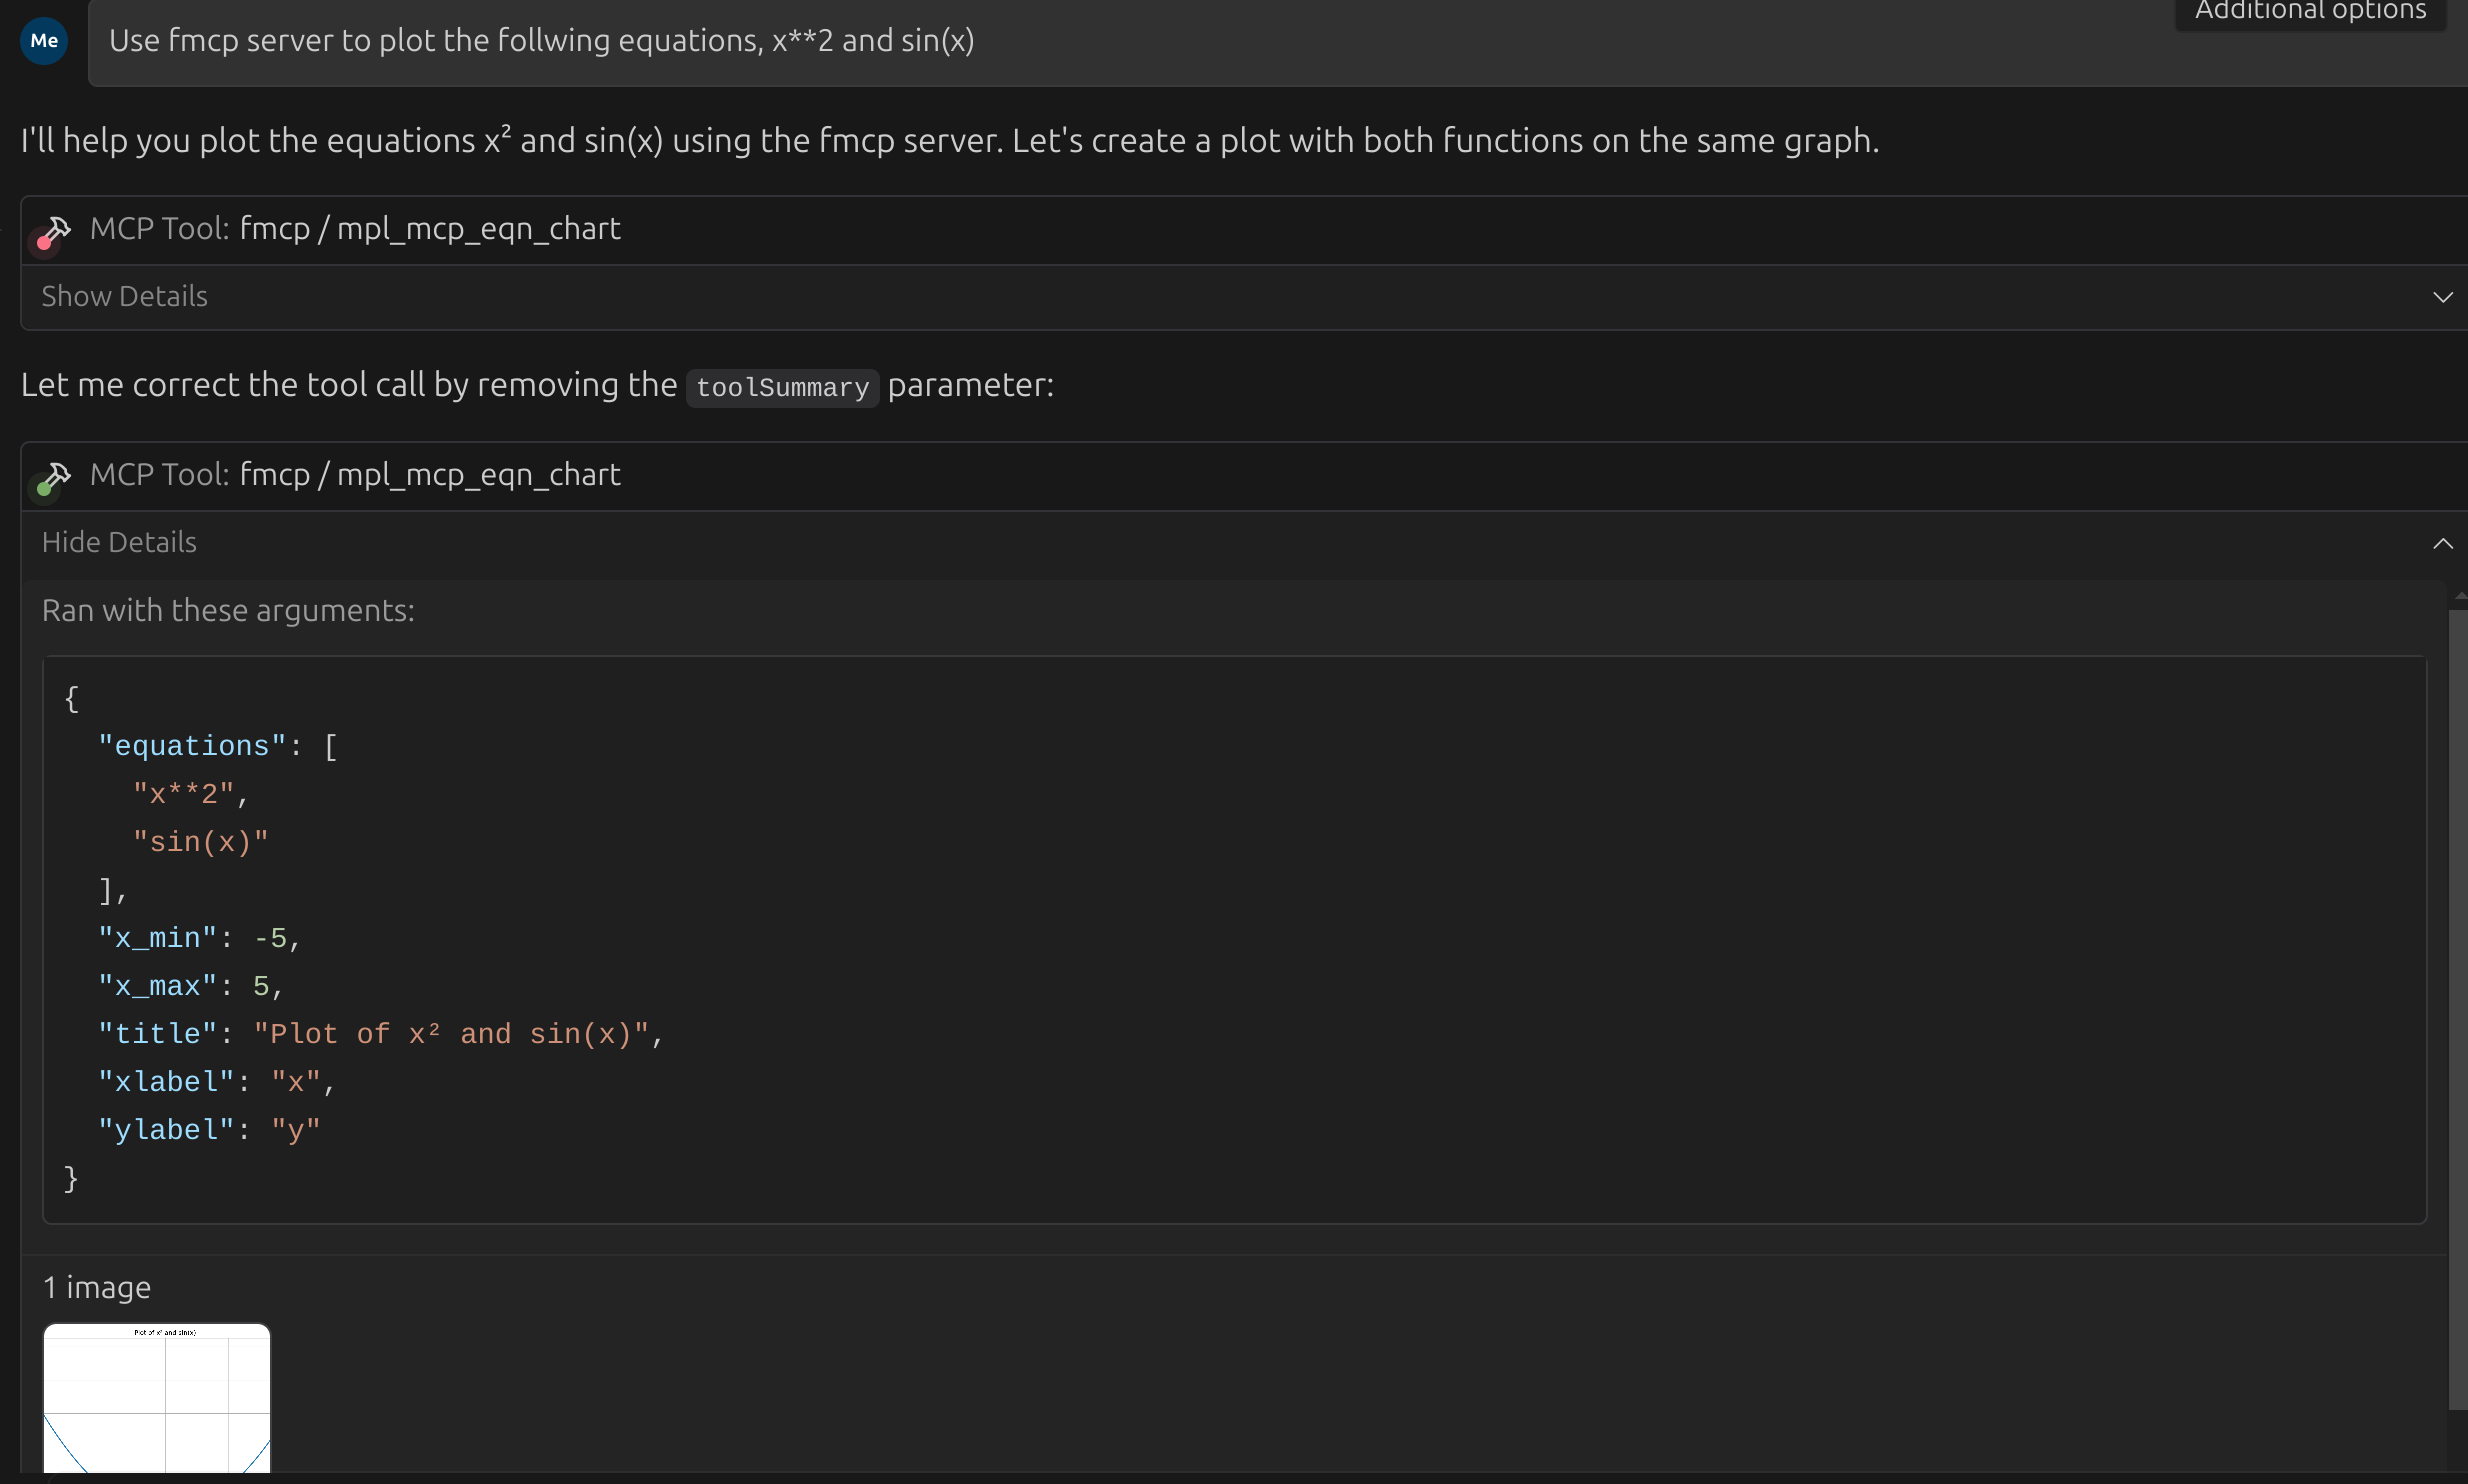
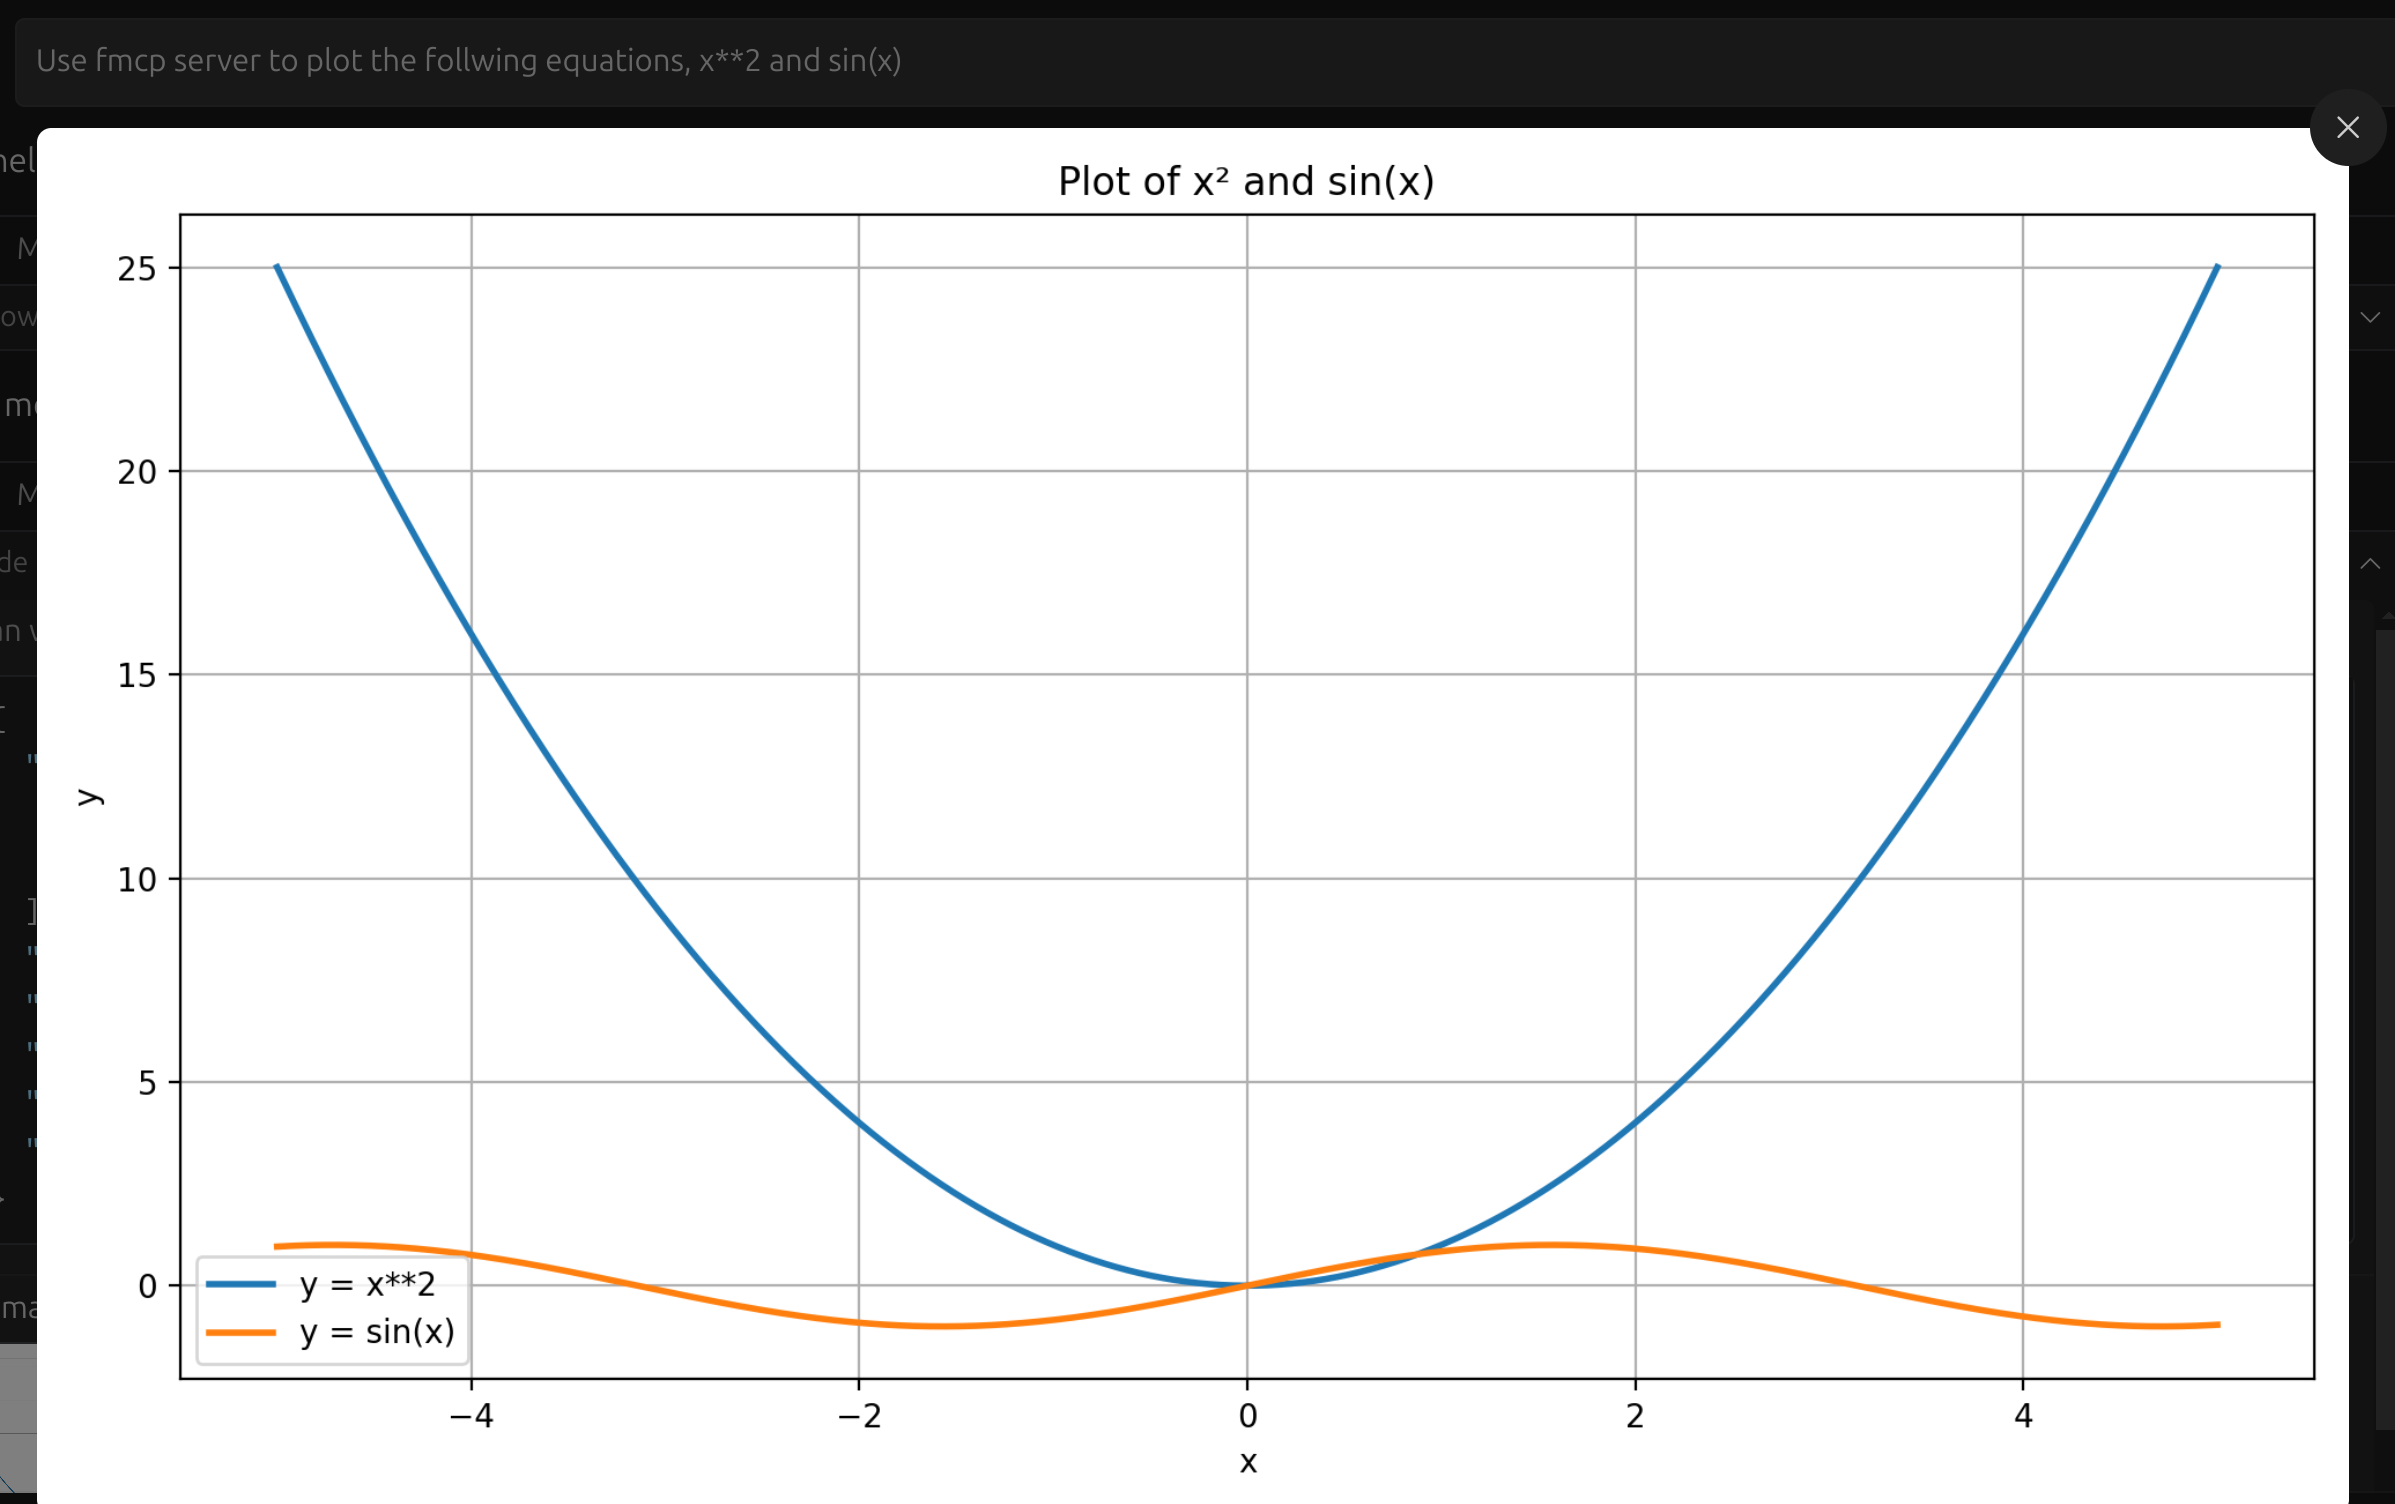
  • Using Visual Studio Code, Windsurf Here the task was to plot both x**2 and sin(x) in the same plot. GUI Demo 1-2 GUI Demo 2-2

Available Tools

12 tools
mpl_mcp_eqn_chartD

Plots mathematical equations

ParametersJSON Schema
NameRequiredDescriptionDefault
equationsYes
x_minNo
x_maxNo
num_pointsNo
titleNoEquation Plot
xlabelNox
ylabelNoy
gridNo
legendNo
figsizeNo
linewidthNo
linestyleNo-
alphaNo
dpiNo
saveNo

TDQS

D1.7/5.0
Behavior1/5

Does the description disclose side effects, auth requirements, rate limits, or destructive behavior?

With no annotations provided, the description carries the full burden of behavioral disclosure but provides almost none. 'Plots mathematical equations' doesn't indicate whether this generates visual output, returns data, saves files, or has side effects. The 15 parameters suggest complex behavior, but the description gives no insight into what the tool actually produces, how it handles errors, whether it's idempotent, or any performance characteristics. For a tool with this many parameters and no annotations, the description is completely inadequate.

Agents need to know what a tool does to the world before calling it. Descriptions should go beyond structured annotations to explain consequences.

Conciseness5/5

Is the description appropriately sized, front-loaded, and free of redundancy?

The description is maximally concise at just two words. While this represents severe under-specification rather than ideal conciseness, from a pure structural perspective, there's no wasted language or unnecessary elaboration. Every word ('Plots mathematical equations') directly addresses the tool's function, making it technically efficient if inadequate in content.

Shorter descriptions cost fewer tokens and are easier for agents to parse. Every sentence should earn its place.

Completeness1/5

Given the tool's complexity, does the description cover enough for an agent to succeed on first attempt?

The description is completely inadequate given the tool's complexity. With 15 parameters, no annotations, no output schema, and 11 sibling tools, the two-word description fails to provide the necessary context for an agent to understand when and how to use this tool effectively. It doesn't explain what the tool produces, how it differs from alternatives, what the parameters mean, or any behavioral characteristics. This is a high-complexity tool with minimal description.

Complex tools with many parameters or behaviors need more documentation. Simple tools need less. This dimension scales expectations accordingly.

Parameters1/5

Does the description clarify parameter syntax, constraints, interactions, or defaults beyond what the schema provides?

With 15 parameters and 0% schema description coverage, the description provides zero information about any parameters. The schema has titles but no descriptions, so parameters like 'equations', 'x_min', 'figsize', 'save', etc. have no semantic explanation. The description doesn't mention any parameters, their purposes, or how they interact. For a tool with this many undocumented parameters, the description fails completely to compensate for the schema coverage gap.

Input schemas describe structure but not intent. Descriptions should explain non-obvious parameter relationships and valid value ranges.

Purpose2/5

Does the description clearly state what the tool does and how it differs from similar tools?

The description 'Plots mathematical equations' is a tautology that essentially restates the tool name 'mpl_mcp_eqn_chart'. While it indicates the general domain (plotting equations), it lacks specificity about what distinguishes this tool from its many siblings, particularly other plotting tools like 'mpl_mcp_plot_chart' or equation-related tools like 'sympy_mcp_equation_operation'. The description doesn't clarify if this is for 2D plots, what types of equations it handles, or how it differs from other visualization tools.

Agents choose between tools based on descriptions. A clear purpose with a specific verb and resource helps agents select the right tool.

Usage Guidelines1/5

Does the description explain when to use this tool, when not to, or what alternatives exist?

The description provides absolutely no guidance on when to use this tool versus alternatives. With 11 sibling tools including multiple plotting tools (barchart, scatter, stack, stem, general chart) and equation operation tools, the agent has no information about when this specific equation plotting tool is appropriate versus other visualization or mathematical tools. There's no mention of prerequisites, typical use cases, or comparison to siblings.

Agents often have multiple tools that could apply. Explicit usage guidance like "use X instead of Y when Z" prevents misuse.

mpl_mcp_plot_barchartD

Plots barchart of given datavalues

ParametersJSON Schema
NameRequiredDescriptionDefault
valuesYes
labelsNo
titleNo
xlabelNo
ylabelNo
colorNoskyblue
saveNo
dpiNo
orientationNovertical

TDQS

D1.9/5.0
Behavior1/5

Does the description disclose side effects, auth requirements, rate limits, or destructive behavior?

No annotations are provided, so the description carries full burden for behavioral disclosure. The description reveals nothing about whether this creates visual output, saves files, requires specific dependencies, has performance characteristics, or what happens when invoked. 'Plots' is the only behavioral clue, which is insufficient for a tool with 9 parameters.

Agents need to know what a tool does to the world before calling it. Descriptions should go beyond structured annotations to explain consequences.

Conciseness5/5

Is the description appropriately sized, front-loaded, and free of redundancy?

The description is extremely concise at just 5 words. While this represents under-specification rather than ideal conciseness, it contains zero wasted words and is front-loaded with the core action. Every word earns its place, even if more content is needed.

Shorter descriptions cost fewer tokens and are easier for agents to parse. Every sentence should earn its place.

Completeness1/5

Given the tool's complexity, does the description cover enough for an agent to succeed on first attempt?

For a 9-parameter plotting tool with no annotations, no output schema, and multiple sibling tools, the description is completely inadequate. It doesn't explain what the tool produces (visual display? file output?), how to interpret parameters, when to use it, or any behavioral characteristics. The agent would struggle to use this tool effectively.

Complex tools with many parameters or behaviors need more documentation. Simple tools need less. This dimension scales expectations accordingly.

Parameters1/5

Does the description clarify parameter syntax, constraints, interactions, or defaults beyond what the schema provides?

With 0% schema description coverage and 9 parameters (8 optional), the description provides no information about any parameters. It doesn't mention the required 'values' array, optional labels, title, axis labels, color, save option, DPI, or orientation. The schema must carry all parameter documentation burden.

Input schemas describe structure but not intent. Descriptions should explain non-obvious parameter relationships and valid value ranges.

Purpose3/5

Does the description clearly state what the tool does and how it differs from similar tools?

The description 'Plots barchart of given datavalues' states the basic action (plots) and resource (barchart), but is vague about scope and lacks differentiation from sibling tools like 'mpl_mcp_plot_chart' or 'mpl_mcp_plot_stack'. It doesn't specify what makes this barchart tool unique among the various plotting tools available.

Agents choose between tools based on descriptions. A clear purpose with a specific verb and resource helps agents select the right tool.

Usage Guidelines1/5

Does the description explain when to use this tool, when not to, or what alternatives exist?

No guidance is provided on when to use this tool versus alternatives. With multiple sibling plotting tools (plot_chart, plot_scatter, plot_stack, plot_stem), the description offers no context about when a barchart is appropriate or when other chart types might be better suited.

Agents often have multiple tools that could apply. Explicit usage guidance like "use X instead of Y when Z" prevents misuse.

mpl_mcp_plot_chartC

Plots line/scatter/bar chart of given datavalues

ParametersJSON Schema
NameRequiredDescriptionDefault
x_dataYes
y_dataYes
plot_typeNoline
labelsNo
titleNo
xlabelNo
ylabelNo
colorNoskyblue
saveNo
dpiNo
figsizeNo
gridNo
legendNo

TDQS

C2.8/5.0
Behavior2/5

Does the description disclose side effects, auth requirements, rate limits, or destructive behavior?

With no annotations provided, the description carries the full burden of behavioral disclosure. It mentions plotting but doesn't explain what happens (e.g., displays plot, saves file, returns image data), whether it's interactive, what permissions are needed, or any side effects. For a tool with 13 parameters and no annotation coverage, this is a significant gap.

Agents need to know what a tool does to the world before calling it. Descriptions should go beyond structured annotations to explain consequences.

Conciseness5/5

Is the description appropriately sized, front-loaded, and free of redundancy?

The description is extremely concise with a single, efficient sentence that front-loads the core functionality. There's no wasted verbiage, though this brevity comes at the cost of completeness.

Shorter descriptions cost fewer tokens and are easier for agents to parse. Every sentence should earn its place.

Completeness2/5

Given the tool's complexity, does the description cover enough for an agent to succeed on first attempt?

Given the complexity (13 parameters, no annotations, no output schema), the description is incomplete. It doesn't explain what the tool returns (plot display, file path, image data), how to interpret parameters, or behavioral details. This is inadequate for a multi-parameter plotting tool with specialized siblings.

Complex tools with many parameters or behaviors need more documentation. Simple tools need less. This dimension scales expectations accordingly.

Parameters2/5

Does the description clarify parameter syntax, constraints, interactions, or defaults beyond what the schema provides?

Schema description coverage is 0%, so the description must compensate for all 13 parameters. It only mentions 'datavalues' (implied x_data and y_data) and chart types (plot_type), ignoring 11 other parameters like labels, title, save, dpi, etc. This leaves most parameters undocumented and their purposes unclear.

Input schemas describe structure but not intent. Descriptions should explain non-obvious parameter relationships and valid value ranges.

Purpose4/5

Does the description clearly state what the tool does and how it differs from similar tools?

The description clearly states the verb ('plots') and resource ('chart of given datavalues'), specifying the chart types (line/scatter/bar). However, it doesn't explicitly differentiate from sibling tools like mpl_mcp_plot_barchart or mpl_mcp_plot_scatter, which appear to be specialized versions of this general plotting tool.

Agents choose between tools based on descriptions. A clear purpose with a specific verb and resource helps agents select the right tool.

Usage Guidelines2/5

Does the description explain when to use this tool, when not to, or what alternatives exist?

No guidance is provided about when to use this tool versus the specialized sibling tools (mpl_mcp_plot_barchart, mpl_mcp_plot_scatter, etc.). The description doesn't mention any prerequisites, context for usage, or alternatives, leaving the agent to guess based on tool names alone.

Agents often have multiple tools that could apply. Explicit usage guidance like "use X instead of Y when Z" prevents misuse.

mpl_mcp_plot_scatterC

Plots scatter chart of given datavalues

ParametersJSON Schema
NameRequiredDescriptionDefault
x_dataYes
y_dataYes
labelsNo
titleNo
xlabelNo
ylabelNo
colorNoblue
sizeNo
alphaNo
markerNoo
edgecolorsNoface
linewidthsNo
saveNo
dpiNo
figsizeNo
gridNo
legendNo

TDQS

C2.7/5.0
Behavior2/5

Does the description disclose side effects, auth requirements, rate limits, or destructive behavior?

With no annotations provided, the description carries full burden but provides minimal behavioral information. It states what the tool does but doesn't disclose whether it creates visual output, saves files, requires specific data formats, or has any side effects. 'Plots' implies visual generation, but details about output format, display behavior, or file handling are missing.

Agents need to know what a tool does to the world before calling it. Descriptions should go beyond structured annotations to explain consequences.

Conciseness5/5

Is the description appropriately sized, front-loaded, and free of redundancy?

Extremely concise single sentence with zero wasted words. The description is front-loaded with the core purpose. While it's under-specified, what's present is efficiently structured without redundancy.

Shorter descriptions cost fewer tokens and are easier for agents to parse. Every sentence should earn its place.

Completeness2/5

Given the tool's complexity, does the description cover enough for an agent to succeed on first attempt?

For a complex tool with 17 parameters, 0% schema description coverage, no annotations, and no output schema, the description is severely inadequate. It identifies the chart type but provides no guidance on parameter usage, output behavior, error conditions, or relationship to sibling tools. The agent would struggle to use this tool effectively.

Complex tools with many parameters or behaviors need more documentation. Simple tools need less. This dimension scales expectations accordingly.

Parameters1/5

Does the description clarify parameter syntax, constraints, interactions, or defaults beyond what the schema provides?

Schema description coverage is 0%, so the description must compensate but fails completely. The description mentions 'given datavalues' which vaguely references x_data and y_data parameters, but provides no explanation for any of the 17 parameters, their purposes, relationships, or how they affect the scatter plot. This leaves most parameters semantically undocumented.

Input schemas describe structure but not intent. Descriptions should explain non-obvious parameter relationships and valid value ranges.

Purpose4/5

Does the description clearly state what the tool does and how it differs from similar tools?

The description clearly states the tool's purpose: 'Plots scatter chart of given datavalues' - a specific verb ('plots') and resource ('scatter chart'). It distinguishes from some siblings (e.g., mpl_mcp_plot_barchart, mpl_mcp_plot_stack) by specifying scatter chart type, but doesn't fully differentiate from mpl_mcp_plot_chart which could be ambiguous.

Agents choose between tools based on descriptions. A clear purpose with a specific verb and resource helps agents select the right tool.

Usage Guidelines2/5

Does the description explain when to use this tool, when not to, or what alternatives exist?

No guidance on when to use this tool versus alternatives. The description doesn't mention when scatter plots are appropriate versus other chart types (bar, stack, stem) available in sibling tools, nor does it provide any context about prerequisites or typical use cases.

Agents often have multiple tools that could apply. Explicit usage guidance like "use X instead of Y when Z" prevents misuse.

mpl_mcp_plot_stackC

Plots stacked area/bar chart of given datavalues

ParametersJSON Schema
NameRequiredDescriptionDefault
x_dataYes
y_dataYes
chart_typeNoarea
labelsNo
titleNo
xlabelNo
ylabelNo
colorsNo
alphaNo
dpiNo
figsizeNo
gridNo
legendNo

TDQS

C2.3/5.0
Behavior2/5

Does the description disclose side effects, auth requirements, rate limits, or destructive behavior?

With no annotations provided, the description carries full burden for behavioral disclosure. It mentions plotting but doesn't describe what happens (e.g., creates a file, displays to screen, returns image data), whether it's read-only or has side effects, performance characteristics, or error conditions. This is inadequate for a 13-parameter tool with no annotation coverage.

Agents need to know what a tool does to the world before calling it. Descriptions should go beyond structured annotations to explain consequences.

Conciseness5/5

Is the description appropriately sized, front-loaded, and free of redundancy?

The description is extremely concise at just one sentence with zero wasted words. It's front-loaded with the core functionality and uses efficient terminology. While it's under-specified, it's not verbose or poorly structured.

Shorter descriptions cost fewer tokens and are easier for agents to parse. Every sentence should earn its place.

Completeness1/5

Given the tool's complexity, does the description cover enough for an agent to succeed on first attempt?

For a complex 13-parameter plotting tool with no annotations, no output schema, and 0% schema description coverage, this description is completely inadequate. It doesn't explain what the tool returns, how parameters interact, what format the output takes, or any behavioral characteristics needed for proper invocation.

Complex tools with many parameters or behaviors need more documentation. Simple tools need less. This dimension scales expectations accordingly.

Parameters1/5

Does the description clarify parameter syntax, constraints, interactions, or defaults beyond what the schema provides?

Schema description coverage is 0%, meaning all 13 parameters have only titles in the schema. The description mentions 'datavalues' but provides no explanation of what x_data and y_data should contain, the difference between area and bar chart types, or how other parameters like colors, alpha, or figsize affect the output. The description fails to compensate for the complete lack of schema documentation.

Input schemas describe structure but not intent. Descriptions should explain non-obvious parameter relationships and valid value ranges.

Purpose3/5

Does the description clearly state what the tool does and how it differs from similar tools?

The description states the tool creates stacked area/bar charts from data values, which is a clear purpose. However, it doesn't differentiate from sibling tools like mpl_mcp_plot_barchart or mpl_mcp_plot_chart, leaving ambiguity about when to choose this specific stacked visualization tool.

Agents choose between tools based on descriptions. A clear purpose with a specific verb and resource helps agents select the right tool.

Usage Guidelines2/5

Does the description explain when to use this tool, when not to, or what alternatives exist?

No guidance is provided about when to use this tool versus alternatives. With multiple plotting siblings (mpl_mcp_plot_barchart, mpl_mcp_plot_chart, etc.), the description offers no comparison or context for selecting this stacked chart option over other visualization tools.

Agents often have multiple tools that could apply. Explicit usage guidance like "use X instead of Y when Z" prevents misuse.

mpl_mcp_plot_stemD

Plots stem chart of given datavalues

ParametersJSON Schema
NameRequiredDescriptionDefault
x_dataYes
y_dataYes
labelsNo
titleNo
xlabelNo
ylabelNo
colorsNoblue
linefmtNo-
markerfmtNoo
basefmtNok-
bottomNo
orientationNovertical
dpiNo
figsizeNo
gridNo
legendNo

TDQS

D1.8/5.0
Behavior1/5

Does the description disclose side effects, auth requirements, rate limits, or destructive behavior?

With no annotations provided, the description carries full burden for behavioral disclosure but provides none. It doesn't mention that this creates a visualization output, what format it returns (image file? display?), whether it has side effects, or any performance considerations. The description only states what it does, not how it behaves.

Agents need to know what a tool does to the world before calling it. Descriptions should go beyond structured annotations to explain consequences.

Conciseness4/5

Is the description appropriately sized, front-loaded, and free of redundancy?

The description is extremely concise - a single 6-word sentence. While this is efficient, it's arguably under-specified given the tool's complexity. However, it's front-loaded with the core purpose and contains no wasted words, earning a high conciseness score despite the content being insufficient.

Shorter descriptions cost fewer tokens and are easier for agents to parse. Every sentence should earn its place.

Completeness1/5

Given the tool's complexity, does the description cover enough for an agent to succeed on first attempt?

For a complex plotting tool with 16 parameters, no annotations, no output schema, and 0% schema description coverage, the description is completely inadequate. It doesn't explain what the tool returns, how to interpret parameters, when to use it, or any behavioral characteristics. The description fails to provide the context needed for effective tool selection and invocation.

Complex tools with many parameters or behaviors need more documentation. Simple tools need less. This dimension scales expectations accordingly.

Parameters1/5

Does the description clarify parameter syntax, constraints, interactions, or defaults beyond what the schema provides?

With 16 parameters and 0% schema description coverage, the description provides no parameter information beyond the tool name. The schema has titles like 'X Data' and 'Y Data' but no descriptions. The tool description doesn't explain what x_data and y_data represent, what formats are acceptable, or how the 14 optional parameters affect the visualization.

Input schemas describe structure but not intent. Descriptions should explain non-obvious parameter relationships and valid value ranges.

Purpose3/5

Does the description clearly state what the tool does and how it differs from similar tools?

The description 'Plots stem chart of given datavalues' clearly states the verb ('plots') and resource ('stem chart'), but it's vague about what a stem chart is and doesn't differentiate from sibling plotting tools like mpl_mcp_plot_barchart or mpl_mcp_plot_scatter. It provides basic purpose but lacks specificity about the visualization type.

Agents choose between tools based on descriptions. A clear purpose with a specific verb and resource helps agents select the right tool.

Usage Guidelines1/5

Does the description explain when to use this tool, when not to, or what alternatives exist?

The description provides no guidance on when to use this tool versus alternatives. With multiple sibling plotting tools (barchart, scatter, stack, etc.), there's no indication of when a stem chart is appropriate versus other visualization types. No usage context, prerequisites, or exclusions are mentioned.

Agents often have multiple tools that could apply. Explicit usage guidance like "use X instead of Y when Z" prevents misuse.

numpy_mcp_matlib_operationC

Do matrix operations: rand-mat, zeros, ones, eye, identity, arange, linspace, reshape, flatten, concatenate, transpose, stack

ParametersJSON Schema
NameRequiredDescriptionDefault
operationYes
dataNo
shapeNo
mNo
nNo
kNo
startNo
stopNo
stepNo
numNo
axisNo

Output Schema

ParametersJSON Schema
NameRequiredDescription
resultYes

TDQS

C2.8/5.0
Behavior2/5

Does the description disclose side effects, auth requirements, rate limits, or destructive behavior?

No annotations are provided, so the description carries the full burden of behavioral disclosure. It lists operations but doesn't explain what each operation does, their side effects (e.g., whether they create new matrices or modify existing ones), error conditions, or output format. For a tool with 11 parameters and no annotation coverage, this is a significant gap in behavioral context.

Agents need to know what a tool does to the world before calling it. Descriptions should go beyond structured annotations to explain consequences.

Conciseness5/5

Is the description appropriately sized, front-loaded, and free of redundancy?

The description is extremely concise—a single sentence listing operations—with zero wasted words. It's front-loaded with the purpose and efficiently enumerates supported operations, making it easy to scan.

Shorter descriptions cost fewer tokens and are easier for agents to parse. Every sentence should earn its place.

Completeness2/5

Given the tool's complexity, does the description cover enough for an agent to succeed on first attempt?

Given the complexity (11 parameters, no annotations, 0% schema coverage) and the presence of an output schema, the description is incomplete. It doesn't explain how operations map to parameters, what inputs are needed for each operation, or behavioral traits. While the output schema might cover return values, the description lacks crucial context for proper tool invocation.

Complex tools with many parameters or behaviors need more documentation. Simple tools need less. This dimension scales expectations accordingly.

Parameters2/5

Does the description clarify parameter syntax, constraints, interactions, or defaults beyond what the schema provides?

Schema description coverage is 0%, meaning none of the 11 parameters have descriptions in the schema. The description lists operations but doesn't explain which parameters correspond to which operations or their meanings (e.g., what 'm', 'n', 'k' represent). It adds minimal value beyond the schema, failing to compensate for the coverage gap.

Input schemas describe structure but not intent. Descriptions should explain non-obvious parameter relationships and valid value ranges.

Purpose4/5

Does the description clearly state what the tool does and how it differs from similar tools?

The description clearly states the tool performs 'matrix operations' and lists specific operations (rand-mat, zeros, ones, etc.), providing a specific verb+resource. However, it doesn't explicitly distinguish this from sibling tools like 'sympy_mcp_matrix_operation' or 'numpy_mcp_numerical_operation', which likely handle similar mathematical operations.

Agents choose between tools based on descriptions. A clear purpose with a specific verb and resource helps agents select the right tool.

Usage Guidelines2/5

Does the description explain when to use this tool, when not to, or what alternatives exist?

The description provides no guidance on when to use this tool versus alternatives. There are multiple sibling tools (e.g., sympy_mcp_matrix_operation, numpy_mcp_numerical_operation) that might overlap in functionality, but the description offers no comparison, prerequisites, or context for selection.

Agents often have multiple tools that could apply. Explicit usage guidance like "use X instead of Y when Z" prevents misuse.

numpy_mcp_numerical_operationD

Do numerical operation like add, sub, mul, div, power, abs, exp, log, sqrt, sin, cos, tan, mean, median, std, var, min, max, argmin, argmax, percentile, dot, matmul, inv, det, eig, solve, svd

ParametersJSON Schema
NameRequiredDescriptionDefault
operationYes
aNo
bNo
shapeNo
new_shapeNo
axisNo
qNo
startNo
stopNo
stepNo
numNo
fill_valueNo

Output Schema

ParametersJSON Schema
NameRequiredDescription
resultYes

TDQS

D1.9/5.0
Behavior1/5

Does the description disclose side effects, auth requirements, rate limits, or destructive behavior?

No annotations are provided, and the description offers no behavioral information. It doesn't mention that this is a computational tool, whether operations are performed in-memory, what the output format is, error handling, performance characteristics, or any constraints. The description is purely a list of operation names without context.

Agents need to know what a tool does to the world before calling it. Descriptions should go beyond structured annotations to explain consequences.

Conciseness2/5

Is the description appropriately sized, front-loaded, and free of redundancy?

While technically concise as a single run-on list, the structure is poor - it's just a comma-separated enumeration without proper sentence structure or organization. The information isn't front-loaded with purpose; it jumps straight to listing operations without context.

Shorter descriptions cost fewer tokens and are easier for agents to parse. Every sentence should earn its place.

Completeness2/5

Given the tool's complexity, does the description cover enough for an agent to succeed on first attempt?

For a complex tool with 12 parameters, 0% schema coverage, no annotations, but with an output schema, the description is severely inadequate. It doesn't explain the tool's scope, parameter usage, or behavioral characteristics. The output schema helps with return values, but the description doesn't provide the necessary context for proper tool selection and invocation.

Complex tools with many parameters or behaviors need more documentation. Simple tools need less. This dimension scales expectations accordingly.

Parameters1/5

Does the description clarify parameter syntax, constraints, interactions, or defaults beyond what the schema provides?

With 12 parameters and 0% schema description coverage, the description provides zero information about parameters. It doesn't explain what 'operation' expects (the listed operations), how 'a' and 'b' relate to operations, what 'shape' and 'new_shape' do, or how other parameters like 'axis', 'q', 'start/stop/step' are used. The description fails to compensate for the complete lack of schema documentation.

Input schemas describe structure but not intent. Descriptions should explain non-obvious parameter relationships and valid value ranges.

Purpose3/5

Does the description clearly state what the tool does and how it differs from similar tools?

The description lists operations but is vague about what the tool actually does - it doesn't specify that it performs numerical operations on arrays/numbers using NumPy. While it distinguishes from plotting siblings, it doesn't clearly differentiate from other numerical/matrix operation siblings like numpy_mcp_matlib_operation or sympy_mcp_matrix_operation.

Agents choose between tools based on descriptions. A clear purpose with a specific verb and resource helps agents select the right tool.

Usage Guidelines2/5

Does the description explain when to use this tool, when not to, or what alternatives exist?

No guidance on when to use this tool versus alternatives. The description doesn't mention NumPy specifically, provide context about numerical vs symbolic computation, or indicate when to choose this over sibling tools like sympy_mcp_algebra_operation or numpy_mcp_matlib_operation.

Agents often have multiple tools that could apply. Explicit usage guidance like "use X instead of Y when Z" prevents misuse.

sympy_mcp_algebra_operationC

Do algebraic operations like simplify, expand, factor, collect

ParametersJSON Schema
NameRequiredDescriptionDefault
operationYes
exprYes
symsNo
rationalNo
ratioNo
measureNo
deepNo
modulusNo
power_baseNo
power_expNo
mulNo
logNo
multinomialNo
basicNo
fracNo
signNo
evaluateNo
exactNo

Output Schema

ParametersJSON Schema
NameRequiredDescription
resultYes

TDQS

C2.7/5.0
Behavior2/5

Does the description disclose side effects, auth requirements, rate limits, or destructive behavior?

With no annotations provided, the description carries the full burden of behavioral disclosure. It mentions what operations are available but doesn't describe what these operations do, their mathematical effects, error conditions, performance characteristics, or output format. For a tool with 18 parameters and complex mathematical operations, this is a significant gap.

Agents need to know what a tool does to the world before calling it. Descriptions should go beyond structured annotations to explain consequences.

Conciseness5/5

Is the description appropriately sized, front-loaded, and free of redundancy?

The description is extremely concise - a single sentence that directly states the tool's purpose. There's no wasted space or unnecessary elaboration. It's appropriately sized for what it does convey, though it's under-specified rather than concise.

Shorter descriptions cost fewer tokens and are easier for agents to parse. Every sentence should earn its place.

Completeness2/5

Given the tool's complexity, does the description cover enough for an agent to succeed on first attempt?

Given the complexity (18 parameters, mathematical operations), lack of annotations, and 0% schema description coverage, the description is severely incomplete. While an output schema exists (which helps with return values), the description doesn't provide enough context about when to use which operation, what the parameters mean, or the mathematical behavior of the tool.

Complex tools with many parameters or behaviors need more documentation. Simple tools need less. This dimension scales expectations accordingly.

Parameters1/5

Does the description clarify parameter syntax, constraints, interactions, or defaults beyond what the schema provides?

With 0% schema description coverage and 18 parameters (only 2 required), the description provides absolutely no information about parameters. It doesn't explain what 'expr' should contain, what 'syms' represents, or what any of the 16 optional parameters control. This fails to compensate for the complete lack of schema documentation.

Input schemas describe structure but not intent. Descriptions should explain non-obvious parameter relationships and valid value ranges.

Purpose4/5

Does the description clearly state what the tool does and how it differs from similar tools?

The description clearly states the tool performs algebraic operations and lists specific operations (simplify, expand, factor, collect), providing a specific verb+resource combination. However, it doesn't differentiate from sibling tools like sympy_mcp_calculus_operation or sympy_mcp_equation_operation, which likely handle related mathematical operations.

Agents choose between tools based on descriptions. A clear purpose with a specific verb and resource helps agents select the right tool.

Usage Guidelines2/5

Does the description explain when to use this tool, when not to, or what alternatives exist?

The description provides no guidance on when to use this tool versus alternatives. It doesn't mention when to choose algebraic operations over calculus or equation operations from sibling tools, nor does it specify prerequisites or exclusions for usage.

Agents often have multiple tools that could apply. Explicit usage guidance like "use X instead of Y when Z" prevents misuse.

sympy_mcp_calculus_operationC

Do calculus operations like diff, integrate, limit, series

ParametersJSON Schema
NameRequiredDescriptionDefault
operationYes
exprYes
symNo
nNo
lowerNo
upperNo
pointNo
directionNo+
series_nNo

Output Schema

ParametersJSON Schema
NameRequiredDescription
resultYes

TDQS

C2.1/5.0
Behavior1/5

Does the description disclose side effects, auth requirements, rate limits, or destructive behavior?

No annotations are provided, so the description carries the full burden of behavioral disclosure. However, it only lists operation types without explaining what the tool does (e.g., computes derivatives, integrals, etc.), expected outputs, error conditions, or performance traits. This is inadequate for a tool with 9 parameters and complex operations.

Agents need to know what a tool does to the world before calling it. Descriptions should go beyond structured annotations to explain consequences.

Conciseness4/5

Is the description appropriately sized, front-loaded, and free of redundancy?

The description is a single, efficient sentence with no wasted words. It's front-loaded with the core purpose, though it could be more structured by separating operation examples. The brevity is appropriate but under-specified.

Shorter descriptions cost fewer tokens and are easier for agents to parse. Every sentence should earn its place.

Completeness2/5

Given the tool's complexity, does the description cover enough for an agent to succeed on first attempt?

Given the tool's complexity (9 parameters, calculus operations), no annotations, and 0% schema coverage, the description is incomplete. While an output schema exists, the description lacks essential context like input formats, mathematical assumptions, or error handling. It doesn't provide enough information for reliable use.

Complex tools with many parameters or behaviors need more documentation. Simple tools need less. This dimension scales expectations accordingly.

Parameters1/5

Does the description clarify parameter syntax, constraints, interactions, or defaults beyond what the schema provides?

Schema description coverage is 0%, meaning parameters like 'expr', 'sym', 'n', 'lower', 'upper', 'point', 'direction', and 'series_n' are undocumented in the schema. The description adds no meaning beyond the operation names, failing to compensate for the coverage gap. For example, it doesn't clarify that 'expr' is a mathematical expression string or how parameters interact.

Input schemas describe structure but not intent. Descriptions should explain non-obvious parameter relationships and valid value ranges.

Purpose3/5

Does the description clearly state what the tool does and how it differs from similar tools?

The description 'Do calculus operations like diff, integrate, limit, series' states the general purpose (calculus operations) and lists examples, but it's vague about the specific resource (mathematical expressions) and doesn't distinguish from sibling tools like sympy_mcp_algebra_operation or sympy_mcp_equation_operation. It provides a basic idea but lacks specificity.

Agents choose between tools based on descriptions. A clear purpose with a specific verb and resource helps agents select the right tool.

Usage Guidelines2/5

Does the description explain when to use this tool, when not to, or what alternatives exist?

No guidance is provided on when to use this tool versus alternatives. The description lists operations but doesn't mention prerequisites, when to choose this over other sympy tools, or any exclusions. This leaves the agent without context for tool selection.

Agents often have multiple tools that could apply. Explicit usage guidance like "use X instead of Y when Z" prevents misuse.

sympy_mcp_equation_operationC

Do symbolic equation operations like solve, solveset, linsolve, nonlinsolve

ParametersJSON Schema
NameRequiredDescriptionDefault
operationYes
equationsYes
symbolsNo
domainNo
checkNo
simplifyNo
rationalNo
minimalNo
forceNo
implicitNo

Output Schema

ParametersJSON Schema
NameRequiredDescription
resultYes

TDQS

C2.2/5.0
Behavior1/5

Does the description disclose side effects, auth requirements, rate limits, or destructive behavior?

No annotations are provided, so the description carries the full burden of behavioral disclosure. However, it only lists operation names without explaining what they do (e.g., solve for solutions, solveset for solution sets, linsolve for linear systems, nonlinsolve for nonlinear systems), their effects (e.g., returns symbolic expressions, may raise errors), or any constraints (e.g., performance, input formats). This leaves critical behavioral traits like output format, error handling, and computational limits completely unspecified.

Agents need to know what a tool does to the world before calling it. Descriptions should go beyond structured annotations to explain consequences.

Conciseness5/5

Is the description appropriately sized, front-loaded, and free of redundancy?

The description is extremely concise, consisting of a single sentence that directly states the tool's purpose with no wasted words. It is front-loaded and efficiently communicates the core functionality, making it easy to scan. However, this conciseness comes at the cost of completeness, as noted in other dimensions.

Shorter descriptions cost fewer tokens and are easier for agents to parse. Every sentence should earn its place.

Completeness2/5

Given the tool's complexity, does the description cover enough for an agent to succeed on first attempt?

Given the complexity (10 parameters, no annotations, 0% schema coverage) and the presence of an output schema, the description is incomplete. While the output schema may cover return values, the description lacks essential details: it doesn't explain the operations, parameter meanings, usage context, or behavioral traits. For a tool with many parameters and no annotation support, this minimal description is inadequate to guide effective use.

Complex tools with many parameters or behaviors need more documentation. Simple tools need less. This dimension scales expectations accordingly.

Parameters1/5

Does the description clarify parameter syntax, constraints, interactions, or defaults beyond what the schema provides?

With 10 parameters and 0% schema description coverage, the schema provides no descriptions for any parameters. The description adds no information about what parameters like 'equations', 'symbols', 'domain', or flags such as 'check' and 'simplify' mean, their expected formats, or how they interact with operations. This fails to compensate for the lack of schema documentation, leaving parameters largely unexplained.

Input schemas describe structure but not intent. Descriptions should explain non-obvious parameter relationships and valid value ranges.

Purpose3/5

Does the description clearly state what the tool does and how it differs from similar tools?

The description states the tool performs symbolic equation operations and lists four specific operations (solve, solveset, linsolve, nonlinsolve), which provides a general purpose. However, it lacks specificity about what these operations do (e.g., solving equations vs. other symbolic manipulations) and doesn't clearly distinguish from sibling tools like sympy_mcp_algebra_operation or sympy_mcp_calculus_operation, which may have overlapping functionality. The phrase 'like solve, solveset, linsolve, nonlinsolve' is somewhat vague, as it doesn't define the scope beyond listing examples.

Agents choose between tools based on descriptions. A clear purpose with a specific verb and resource helps agents select the right tool.

Usage Guidelines2/5

Does the description explain when to use this tool, when not to, or what alternatives exist?

The description provides no guidance on when to use this tool versus alternatives. It doesn't mention any context, prerequisites, or exclusions, such as when to choose this over sibling tools like sympy_mcp_algebra_operation or sympy_mcp_calculus_operation, or what types of equations are suitable. Without such information, users must infer usage from the operation names alone, which is insufficient for effective tool selection.

Agents often have multiple tools that could apply. Explicit usage guidance like "use X instead of Y when Z" prevents misuse.

sympy_mcp_matrix_operationC

Do symbolic matrix operations like create, det, inv, rref, eigenvals

ParametersJSON Schema
NameRequiredDescriptionDefault
operationYes
dataYes
rationalNo
nrowsNo
ncolsNo
simplifyNo

TDQS

C2.8/5.0
Behavior2/5

Does the description disclose side effects, auth requirements, rate limits, or destructive behavior?

No annotations are provided, so the description carries the full burden. It mentions 'symbolic matrix operations' which implies mathematical computation, but doesn't disclose behavioral traits like error handling, performance characteristics, whether operations are read-only or mutating, or what the output format looks like. The description is too minimal for a tool with 6 parameters.

Agents need to know what a tool does to the world before calling it. Descriptions should go beyond structured annotations to explain consequences.

Conciseness5/5

Is the description appropriately sized, front-loaded, and free of redundancy?

The description is extremely concise with a single sentence that efficiently lists the key operations. It's front-loaded with the core purpose and wastes no words, though this conciseness comes at the cost of completeness.

Shorter descriptions cost fewer tokens and are easier for agents to parse. Every sentence should earn its place.

Completeness2/5

Given the tool's complexity, does the description cover enough for an agent to succeed on first attempt?

For a tool with 6 parameters, 0% schema description coverage, no annotations, and no output schema, the description is inadequate. It doesn't explain parameter usage, return values, error conditions, or behavioral expectations. The minimal description fails to provide necessary context for proper tool invocation.

Complex tools with many parameters or behaviors need more documentation. Simple tools need less. This dimension scales expectations accordingly.

Parameters2/5

Does the description clarify parameter syntax, constraints, interactions, or defaults beyond what the schema provides?

Schema description coverage is 0%, so the description must compensate. It lists operation types but doesn't explain what 'data' parameter should contain, what 'rational' and 'simplify' flags do, or when 'nrows' and 'ncols' are needed. The description adds minimal value beyond the schema's enum for 'operation'.

Input schemas describe structure but not intent. Descriptions should explain non-obvious parameter relationships and valid value ranges.

Purpose4/5

Does the description clearly state what the tool does and how it differs from similar tools?

The description clearly states the tool performs symbolic matrix operations and lists specific operations (create, det, inv, rref, eigenvals), providing a specific verb+resource combination. However, it doesn't explicitly differentiate from sibling tools like sympy_mcp_algebra_operation or numpy_mcp_matlib_operation, which might also handle matrix operations.

Agents choose between tools based on descriptions. A clear purpose with a specific verb and resource helps agents select the right tool.

Usage Guidelines2/5

Does the description explain when to use this tool, when not to, or what alternatives exist?

The description provides no guidance on when to use this tool versus alternatives like sympy_mcp_algebra_operation or numpy_mcp_matlib_operation. It lists operations but doesn't specify context, prerequisites, or exclusions for usage.

Agents often have multiple tools that could apply. Explicit usage guidance like "use X instead of Y when Z" prevents misuse.

Tool Schema Changelog

Recent tool additions, removals, and schema changes observed during successful MCP inspections. Dates show when Glama detected each change.

  1. 6 tool updatesv1.0.0
    • Changedmpl_mcp_eqn_chart14 fields changed
      • addedInput schema / properties / alpha / anyOf
        Added value: +[
        +  {
        +    "type": "number"
        +  },
        +  {
        +    "type": "integer"
        +  }
        +]
      • removedInput schema / properties / alpha / type
        Removed value: -"number"
      • addedInput schema / properties / dpi / anyOf
        Added value: +[
        +  {
        +    "type": "integer"
        +  },
        +  {
        +    "type": "number"
        +  }
        +]
      • removedInput schema / properties / dpi / type
        Removed value: -"integer"
      • addedInput schema / properties / figsize / items / anyOf
        Added value: +[
        +  {
        +    "type": "number"
        +  },
        +  {
        +    "type": "integer"
        +  }
        +]
      • removedInput schema / properties / figsize / items / type
        Removed value: -"integer"
      • addedInput schema / properties / linewidth / anyOf
        Added value: +[
        +  {
        +    "type": "number"
        +  },
        +  {
        +    "type": "integer"
        +  }
        +]
      • removedInput schema / properties / linewidth / type
        Removed value: -"number"
      • addedInput schema / properties / num_points / anyOf
        Added value: +[
        +  {
        +    "type": "integer"
        +  },
        +  {
        +    "type": "number"
        +  }
        +]
      • removedInput schema / properties / num_points / type
        Removed value: -"integer"
      • addedInput schema / properties / x_max / anyOf
        Added value: +[
        +  {
        +    "type": "number"
        +  },
        +  {
        +    "type": "integer"
        +  }
        +]
      • removedInput schema / properties / x_max / type
        Removed value: -"number"
      • addedInput schema / properties / x_min / anyOf
        Added value: +[
        +  {
        +    "type": "number"
        +  },
        +  {
        +    "type": "integer"
        +  }
        +]
      • removedInput schema / properties / x_min / type
        Removed value: -"number"
    • Changedmpl_mcp_plot_barchart2 fields changed
      • addedInput schema / properties / values / items / anyOf
        Added value: +[
        +  {
        +    "type": "number"
        +  },
        +  {
        +    "type": "integer"
        +  }
        +]
      • removedInput schema / properties / values / items / type
        Removed value: -"number"
    • Changedmpl_mcp_plot_chart4 fields changed
      • changedInput schema / properties / figsize / anyOf
        Previous value: -[
        -  {
        -    "items": {
        -      "type": "integer"
        -    },
        -    "type": "array"
        -  },
        -  {
        -    "type": "null"
        -  }
        -]New value: +[
        +  {
        +    "items": {
        +      "anyOf": [
        +        {
        +          "type": "number"
        +        },
        +        {
        +          "type": "integer"
        +        }
        +      ]
        +    },
        +    "type": "array"
        +  },
        +  {
        +    "type": "null"
        +  }
        +]
      • addedInput schema / properties / x_data / items / anyOf
        Added value: +[
        +  {
        +    "type": "number"
        +  },
        +  {
        +    "type": "integer"
        +  }
        +]
      • removedInput schema / properties / x_data / items / type
        Removed value: -"number"
      • changedInput schema / properties / y_data / anyOf
        Previous value: -[
        -  {
        -    "items": {
        -      "type": "number"
        -    },
        -    "type": "array"
        -  },
        -  {
        -    "items": {
        -      "items": {
        -        "type": "number"
        -      },
        -      "type": "array"
        -    },
        -    "type": "array"
        -  }
        -]New value: +[
        +  {
        +    "items": {
        +      "anyOf": [
        +        {
        +          "type": "number"
        +        },
        +        {
        +          "type": "integer"
        +        }
        +      ]
        +    },
        +    "type": "array"
        +  },
        +  {
        +    "items": {
        +      "items": {
        +        "anyOf": [
        +          {
        +            "type": "number"
        +          },
        +          {
        +            "type": "integer"
        +          }
        +        ]
        +      },
        +      "type": "array"
        +    },
        +    "type": "array"
        +  }
        +]
    • Changedmpl_mcp_plot_scatter5 fields changed
      • changedInput schema / properties / figsize / anyOf
        Previous value: -[
        -  {
        -    "items": {
        -      "type": "integer"
        -    },
        -    "type": "array"
        -  },
        -  {
        -    "type": "null"
        -  }
        -]New value: +[
        +  {
        +    "items": {
        +      "anyOf": [
        +        {
        +          "type": "number"
        +        },
        +        {
        +          "type": "integer"
        +        }
        +      ]
        +    },
        +    "type": "array"
        +  },
        +  {
        +    "type": "null"
        +  }
        +]
      • addedInput schema / properties / x_data / items / anyOf
        Added value: +[
        +  {
        +    "type": "number"
        +  },
        +  {
        +    "type": "integer"
        +  }
        +]
      • removedInput schema / properties / x_data / items / type
        Removed value: -"number"
      • addedInput schema / properties / y_data / items / anyOf
        Added value: +[
        +  {
        +    "type": "number"
        +  },
        +  {
        +    "type": "integer"
        +  }
        +]
      • removedInput schema / properties / y_data / items / type
        Removed value: -"number"
    • Changedmpl_mcp_plot_stack3 fields changed
      • changedInput schema / properties / figsize / anyOf
        Previous value: -[
        -  {
        -    "items": {
        -      "type": "integer"
        -    },
        -    "type": "array"
        -  },
        -  {
        -    "type": "null"
        -  }
        -]New value: +[
        +  {
        +    "items": {
        +      "anyOf": [
        +        {
        +          "type": "number"
        +        },
        +        {
        +          "type": "integer"
        +        }
        +      ]
        +    },
        +    "type": "array"
        +  },
        +  {
        +    "type": "null"
        +  }
        +]
      • changedInput schema / properties / x_data / anyOf
        Previous value: -[
        -  {
        -    "items": {
        -      "type": "number"
        -    },
        -    "type": "array"
        -  },
        -  {
        -    "items": {
        -      "items": {
        -        "type": "number"
        -      },
        -      "type": "array"
        -    },
        -    "type": "array"
        -  }
        -]New value: +[
        +  {
        +    "items": {
        +      "anyOf": [
        +        {
        +          "type": "number"
        +        },
        +        {
        +          "type": "integer"
        +        }
        +      ]
        +    },
        +    "type": "array"
        +  },
        +  {
        +    "items": {
        +      "items": {
        +        "anyOf": [
        +          {
        +            "type": "number"
        +          },
        +          {
        +            "type": "integer"
        +          }
        +        ]
        +      },
        +      "type": "array"
        +    },
        +    "type": "array"
        +  }
        +]
      • changedInput schema / properties / y_data / anyOf
        Previous value: -[
        -  {
        -    "items": {
        -      "items": {
        -        "type": "number"
        -      },
        -      "type": "array"
        -    },
        -    "type": "array"
        -  },
        -  {
        -    "items": {
        -      "type": "number"
        -    },
        -    "type": "array"
        -  }
        -]New value: +[
        +  {
        +    "items": {
        +      "items": {
        +        "anyOf": [
        +          {
        +            "type": "number"
        +          },
        +          {
        +            "type": "integer"
        +          }
        +        ]
        +      },
        +      "type": "array"
        +    },
        +    "type": "array"
        +  },
        +  {
        +    "items": {
        +      "anyOf": [
        +        {
        +          "type": "number"
        +        },
        +        {
        +          "type": "integer"
        +        }
        +      ]
        +    },
        +    "type": "array"
        +  }
        +]
    • Changedmpl_mcp_plot_stem3 fields changed
      • changedInput schema / properties / figsize / anyOf
        Previous value: -[
        -  {
        -    "items": {
        -      "type": "integer"
        -    },
        -    "type": "array"
        -  },
        -  {
        -    "type": "null"
        -  }
        -]New value: +[
        +  {
        +    "items": {
        +      "anyOf": [
        +        {
        +          "type": "number"
        +        },
        +        {
        +          "type": "integer"
        +        }
        +      ]
        +    },
        +    "type": "array"
        +  },
        +  {
        +    "type": "null"
        +  }
        +]
      • changedInput schema / properties / x_data / anyOf
        Previous value: -[
        -  {
        -    "items": {
        -      "type": "number"
        -    },
        -    "type": "array"
        -  },
        -  {
        -    "items": {
        -      "items": {
        -        "type": "number"
        -      },
        -      "type": "array"
        -    },
        -    "type": "array"
        -  }
        -]New value: +[
        +  {
        +    "items": {
        +      "anyOf": [
        +        {
        +          "type": "number"
        +        },
        +        {
        +          "type": "integer"
        +        }
        +      ]
        +    },
        +    "type": "array"
        +  },
        +  {
        +    "items": {
        +      "items": {
        +        "anyOf": [
        +          {
        +            "type": "number"
        +          },
        +          {
        +            "type": "integer"
        +          }
        +        ]
        +      },
        +      "type": "array"
        +    },
        +    "type": "array"
        +  }
        +]
      • changedInput schema / properties / y_data / anyOf
        Previous value: -[
        -  {
        -    "items": {
        -      "type": "number"
        -    },
        -    "type": "array"
        -  },
        -  {
        -    "items": {
        -      "items": {
        -        "type": "number"
        -      },
        -      "type": "array"
        -    },
        -    "type": "array"
        -  }
        -]New value: +[
        +  {
        +    "items": {
        +      "anyOf": [
        +        {
        +          "type": "number"
        +        },
        +        {
        +          "type": "integer"
        +        }
        +      ]
        +    },
        +    "type": "array"
        +  },
        +  {
        +    "items": {
        +      "items": {
        +        "anyOf": [
        +          {
        +            "type": "number"
        +          },
        +          {
        +            "type": "integer"
        +          }
        +        ]
        +      },
        +      "type": "array"
        +    },
        +    "type": "array"
        +  }
        +]
  2. 12 tool updates
    • First observedmpl_mcp_eqn_chart
    • First observedmpl_mcp_plot_barchart
    • First observedmpl_mcp_plot_chart
    • First observedmpl_mcp_plot_scatter
    • First observedmpl_mcp_plot_stack
    • First observedmpl_mcp_plot_stem
    • First observednumpy_mcp_matlib_operation
    • First observednumpy_mcp_numerical_operation
    • First observedsympy_mcp_algebra_operation
    • First observedsympy_mcp_calculus_operation
    • First observedsympy_mcp_equation_operation
    • First observedsympy_mcp_matrix_operation

TDQS

C2.6/5.0
Disambiguation3/5

The tools are grouped by library (mpl, numpy, sympy) with clear distinctions between groups, but within groups there is significant overlap. For example, mpl_mcp_plot_chart can plot line/scatter/bar charts, making mpl_mcp_plot_barchart and mpl_mcp_plot_scatter partially redundant. Similarly, numpy_mcp_numerical_operation includes matrix operations that overlap with numpy_mcp_matlib_operation, and sympy tools have some functional overlap (e.g., equation solving appears in multiple places). Descriptions help, but agents may struggle to choose between overlapping tools.

Naming Consistency4/5

Naming follows a consistent pattern of library_prefix_mcp_domain_operation (e.g., mpl_mcp_plot_chart, numpy_mcp_matlib_operation). All tools use snake_case consistently. Minor deviations exist, such as 'matlib' vs 'matrix' in numpy tools and slight variations in domain terms (e.g., 'algebra_operation' vs 'calculus_operation'), but the overall structure is predictable and readable.

Tool Count4/5

With 12 tools, the count is reasonable for a mathematical/plotting server covering multiple libraries (matplotlib, numpy, sympy). It's slightly on the higher side but justified by the broad scope. Each tool groups related functionalities, though some consolidation might reduce overlap. The count aligns well with the server's purpose of providing mathematical operations and visualizations.

Completeness4/5

The server covers key mathematical domains: plotting (multiple chart types), numerical operations (basic and advanced), symbolic algebra, calculus, and matrix operations. There are minor gaps, such as no explicit tool for statistical distributions beyond basic stats in numpy, and plotting tools might lack 3D or specialized visualizations. However, core workflows for mathematical analysis and visualization are well-supported, with no major dead ends.

Maintenance

ActivityStale
ResponsivenessSlow

Resources

Unclaimed servers have limited discoverability.

Looking for Admin?

If you are the server author, to access and configure the admin panel.

Related MCP Connectors

Related MCP Servers

  • F
    license
    Not graded
    quality
    D
    maintenance
    A Model Context Protocol (MCP) server that provides mathematical calculations and operations using NumPy, enabling users to perform numerical computations like matrix operations, statistical analysis, and polynomial fitting directly through Claude.
    3
    -
  • A
    license
    C
    quality
    C
    maintenance
    An MCP server that provides access to SymPy's symbolic mathematics library for advanced algebraic computations. It enables users to perform complex tasks such as symbolic simplification, calculus, equation solving, matrix operations, and number theory.
    100
    MIT
  • A
    license
    B
    quality
    D
    maintenance
    A Python-based MCP server providing mathematical computation tools and plotting utilities for a wide range of math topics including calculus, matrix operations, statistics, and more.
    22
    5
    MIT

Latest Blog Posts

MCP directory API

We provide all the information about MCP servers via our MCP API.

curl -X GET 'https://glama.ai/api/mcp/v1/servers/abhiphile/fermat-mcp'

If you have feedback or need assistance with the MCP directory API, please join our Discord server