

A
licenseA
qualityD
maintenanceAn MCP (Model Context Protocol) server that enables interactive debugging with code instrumentation for AI coding assistants. Inspired by Cursor's debug mode.
7
9 npm
1
MIT

Allows running the MCP server with local LLM models through Ollama, with specific support for models like qwen3 that can utilize MCP tools
Used for testing the MCP server functionality and ensuring proper integration with HPC tools
Serves as a core dependency for the MCP server, enabling development and execution of HPC-focused tools
Click on "Deploy Server".
Wait a few minutes for the server to deploy. Once ready, it will show a "Started" state.
In the chat, type @ followed by the MCP server name and your instructions, e.g., "@HPC-MCP debug the crash in my MPI program at examples/mpi/crash.exe"
That's it! The server will respond to your query, and you can continue using it as needed.
Here is a step-by-step guide with screenshots.
This project provides MCP tools for HPC. These are designed to integrate with LLMs. My initial plan is to integrate with LLMs called from IDEs such as cursor and vscode.
This project uses uv for dependency management and installation. If you don't have uv installed, follow installation instructions on their website.
Once we have uv installed we can install the dependencies and run the tests with the following
command:
uv run --dev pytestOpen Cursor and go to settings.
Click Tools & Integrations
Click Add Custom MCP
This will open your system-wide MCP settings ($HOME/.cursor/mcp.json). If you prefer to set this
on a project-by-project basis, then you can create a local configuration using
<path/to/project/root>/.cursor/mcp.json.
Add the following configuration:
{
  "mcpServers": {
    "hpc-mcp": {
      "command": "uv",
      "args": [
                "--directory",
                "<path/to>/hpc-mcp",
                "run",
                "src/debug.py"
            ]
    }
  }
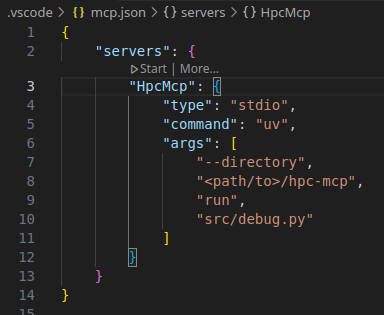
}Open command palette (Ctrl+Shift+p) and select MCP: Add Server...

Choose the option command (stdio) since the server will be run locally
Type the command to run the MCP server:
uv --directory <path/to>/hpc-mcp run src/debug.pySelect reasonable name for the server e.g. "HpcMcp" (camel case is a convention)
Select whether to add the server locally or globally.
You can tune the settings by opening setting.json (global settings) or .vscode/setting.json (workspace settings)
Open Zed and go to settings.
Open general settings CTRL-ALT-C
Under section Model Context Protocol (MCP) Servers click Add Custom Server
Add the following text (changing the <path/to>/hpc-mcp to your actual path)
{
  /// The name of your MCP server
  "hpc-mcp": {
    /// The command which runs the MCP server
    "command": "uv",
    /// The arguments to pass to the MCP server
    "args": [
      "--directory",
      "<path/to>/hpc-mcp",
      "run",
      "src/debug.py"
    ],
    /// The environment variables to set
    "env": {}
  }
}
Test the MCP using our simple example
open terminal
cd example/simple
build the example using make
this should generate segfault.exe
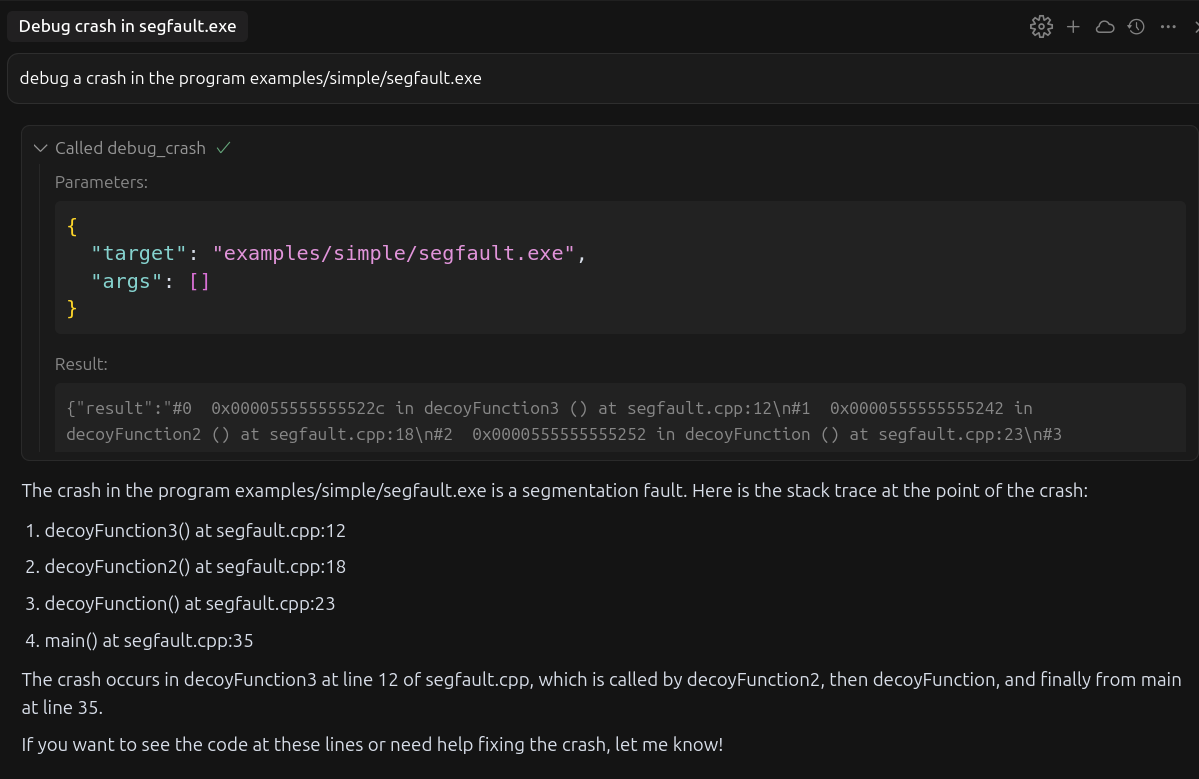
then type the following prompt into your IDE LLM agent
"debug a crash in the program examples/simple/segfault.exe"this should ask your permission to run debug_crash MCP tool
accept and you should get a response like the following
Related MCP server: jlab-mcp
To run the hpc-mcp MCP tool with a local Ollama model use the Zed text editor. It should
automatically detect local running ollama models and make them available. As long as you have
installed the hpc-mcp MCP server in zed (see instructions here) it
should be available to your models. For more info on ollama integration with zed see zed's
documentation.
Not all models support calling of MCP tools. I managed to have success withqwen3:latest.
python
uv
fastmcp
Debug crashing program and return the stack trace.
| Name | Required | Description | Default |
|---|---|---|---|
| target | Yes | ||
| args | Yes |
| Name | Required | Description |
|---|---|---|
| result | Yes |
Does the description disclose side effects, auth requirements, rate limits, or destructive behavior?
With no annotations provided, the description carries the full burden of behavioral disclosure. It mentions that the tool returns a stack trace, which is useful, but fails to describe critical traits like whether it requires specific permissions, if it's read-only or destructive, how it handles errors, or any rate limits. For a tool that interacts with a program (potentially involving execution), this is a significant gap in transparency.
Agents need to know what a tool does to the world before calling it. Descriptions should go beyond structured annotations to explain consequences.
Is the description appropriately sized, front-loaded, and free of redundancy?
The description is extremely concise—a single sentence that directly states the tool's action and output without any fluff. It is front-loaded with the core purpose, making it efficient for quick understanding. Every word earns its place, adhering to best practices for brevity.
Shorter descriptions cost fewer tokens and are easier for agents to parse. Every sentence should earn its place.
Given the tool's complexity, does the description cover enough for an agent to succeed on first attempt?
Given the tool's complexity (involving program debugging), lack of annotations, and 0% schema description coverage, the description is incomplete. It mentions the output (stack trace), and an output schema exists, which helps, but it misses critical context like behavioral traits and parameter meanings. This makes it minimally adequate but with clear gaps for effective agent use.
Complex tools with many parameters or behaviors need more documentation. Simple tools need less. This dimension scales expectations accordingly.
Does the description clarify parameter syntax, constraints, interactions, or defaults beyond what the schema provides?
Schema description coverage is 0%, so the description must compensate for the lack of parameter documentation. It does not explain what 'target' or 'args' represent (e.g., target could be a file path or process ID, args might be command-line arguments), their formats, or examples. This leaves the parameters largely ambiguous, reducing the tool's usability despite the schema defining their types.
Input schemas describe structure but not intent. Descriptions should explain non-obvious parameter relationships and valid value ranges.
Does the description clearly state what the tool does and how it differs from similar tools?
The description clearly states the tool's purpose with a specific verb ('debug') and resource ('crashing program'), and specifies the output ('return the stack trace'). It distinguishes the action from generic debugging by focusing on crash analysis. However, without sibling tools, differentiation isn't tested, preventing a perfect score.
Agents choose between tools based on descriptions. A clear purpose with a specific verb and resource helps agents select the right tool.
Does the description explain when to use this tool, when not to, or what alternatives exist?
The description provides no guidance on when to use this tool versus alternatives, prerequisites, or constraints. It states what the tool does but offers no context for its application, such as when debugging is appropriate or what types of crashes it handles. This lack of usage context limits its helpfulness for an agent.
Agents often have multiple tools that could apply. Explicit usage guidance like "use X instead of Y when Z" prevents misuse.
Recent tool additions, removals, and schema changes observed during successful MCP inspections.
debug_crashScored across 1 tool
With only one tool, there is no possibility of ambiguity or overlap between tools, as there are no other tools to compare it to. The tool's purpose is clearly defined and distinct by default.
Since there is only one tool, naming consistency is inherently perfect—there are no other tools to create inconsistency or mixed conventions. The tool name follows a clear verb_noun pattern.
A single tool is too few for a server named 'HPC-MCP', which suggests a High-Performance Computing domain that typically involves complex workflows like job submission, monitoring, and resource management. This minimal toolset severely limits functionality.
The tool surface is severely incomplete for an HPC domain; it only provides a debug function, missing essential operations such as job submission, status checking, file management, and resource allocation, which are core to HPC workflows.
A comprehensive Model Context Protocol (MCP) server that enables AI assistants to interact with yo…
MCP Server for Slima - AI Writing IDE for Novel Authors with AI Beta Reader.
The Mercado Pago MCP Server implements the Model Context Protocol to provide AI agents and LLMs with access to Mercado Pago's APIs and tools within compatible development environments. It acts as an intermediary that translates Mercado Pago resources into executable functions (tools) that AI applications can invoke to perform actions and automate flows. The server simplifies integration, enables using documentation to implement or improve code, and optimizes operations through natural language interactions without manual implementations.
MCP server for progressive tool usage at any scale (see https://klavis.ai)