Panther MCP Server
OfficialPanther MCP Server lets MCP clients interact with Panther for security operations, detection engineering, and log analysis.
Alerts: list/get alerts, inspect events and comments, add comments, start/get AI triage summaries, update status/assignee, and bulk-update alerts.
Data Lake: run SQL queries, list databases/tables, inspect table schemas, and analyze alert event statistics.
Detections: list/get/disable rules, scheduled rules, simple rules, and policies with filtering.
Security Content: inspect global helpers, data models, log type schemas, and scheduled queries.
Sources: list log sources and retrieve HTTP log source configuration.
Metrics: query alert metrics by rule or severity and data ingestion/bytes-processed metrics.
Users & Access: list/get users, roles, and permissions to troubleshoot access and diagnose permission errors.
Deployment: run via Docker or UVX, using STDIO or streamable HTTP transports.
Supports running the MCP server in a Docker container for a secure, sandboxed environment with minimal blast radius.
Provides access to GitHub functionality through global helpers for handling GitHub events.
Provides Python-based functionality for rule creation, data querying, and alert management through PyPI package distribution.
Integrates with the Ruff linter for Python code quality checking, as indicated by the badge in the README.
Click on "Deploy Server".
Wait a few minutes for the server to deploy. Once ready, it will show a "Started" state.
In the chat, type
@followed by the MCP server name and your instructions, e.g., "@Panther MCP Server show me all high severity alerts from the last 24 hours"
That's it! The server will respond to your query, and you can continue using it as needed.
Here is a step-by-step guide with screenshots.
Panther MCP Server
Panther's Model Context Protocol (MCP) server provides functionality to:
Write and tune detections from your IDE
Interactively query security logs using natural language
Triage, comment, and resolve one or many alerts
Available Tools
Tool Name | Description | Sample Prompt |
| Add a comment to a Panther alert | "Add comment 'Looks pretty bad' to alert abc123" |
| Start an AI-powered triage analysis for a Panther alert with intelligent insights and recommendations | "Start AI triage for alert abc123" / "Generate a detailed AI analysis of alert def456" |
| Retrieve the latest AI triage summary previously generated for a specific alert | "Get the AI triage summary for alert abc123" / "Show me the AI analysis for alert def456" |
| Get detailed information about a specific alert | "What's the status of alert 8def456?" |
| Get a small sampling of events for a given alert | "Show me events associated with alert 8def456" |
| List alerts with comprehensive filtering options (date range, severity, status, etc.) | "Show me all high severity alerts from the last 24 hours" |
| Bulk update multiple alerts with status, assignee, and/or comment changes | "Update alerts abc123, def456, and ghi789 to resolved status and add comment 'Fixed'" |
| Update the assignee of one or more alerts | "Assign alerts abc123 and def456 to John" |
| Update the status of one or more alerts | "Mark alerts abc123 and def456 as resolved" |
| List all comments for a specific alert | "Show me all comments for alert abc123" |
Tool Name | Description | Sample Prompt |
| Execute SQL queries against Panther's data lake with synchronous results | "Query AWS CloudTrail logs for failed login attempts in the last day" |
| Get schema information for a specific table | "Show me the schema for the AWS_CLOUDTRAIL table" |
| List all available data lake databases in Panther | "List all available databases" |
| List all available tables for a specific database in Panther's data lake | "What tables are in the panther_logs database" |
| Analyze patterns and relationships across multiple alerts by aggregating their event data into time-based statistics | "Show me patterns in events from alerts abc123 and def456" |
Tool Name | Description | Sample Prompt |
| List all scheduled queries with pagination support | "Show me all scheduled queries" / "List the first 25 scheduled queries" |
| Get detailed information about a specific scheduled query by ID | "Get details for scheduled query 'weekly-security-report'" |
Tool Name | Description | Sample Prompt |
| List log sources with optional filters (health status, log types, integration type) | "Show me all healthy S3 log sources" |
| Get detailed information about a specific HTTP log source by ID | "Show me the configuration for HTTP source 'webhook-collector-123'" |
Tool Name | Description | Sample Prompt |
| List detections from Panther with comprehensive filtering support. Supports multiple detection types and filtering by name, state, severity, tags, log types, resource types, output IDs (destinations), and more. Returns outputIDs for each detection showing configured alert destinations | "Show me all enabled HIGH severity rules with tag 'AWS'" / "List disabled policies for S3 resources" / "Find all rules with outputID 'prod-slack'" / "Show me detections that alert to production destinations" |
| Get detailed information about a specific detection including the detection body and tests. Accepts a list with one detection type: ["rules"], ["scheduled_rules"], ["simple_rules"], or ["policies"] | "Get details for rule ID abc123" / "Get details for policy ID AWS.S3.Bucket.PublicReadACP" |
| Disable a detection by setting enabled to false. Supports rules, scheduled_rules, simple_rules, and policies | "Disable rule abc123" / "Disable policy AWS.S3.Bucket.PublicReadACP" |
Tool Name | Description | Sample Prompt |
| List global helper functions with comprehensive filtering options (name search, creator, modifier) | "Show me global helpers containing 'aws' in the name" |
| Get detailed information and complete Python code for a specific global helper | "Get the complete code for global helper 'AWSUtilities'" |
Tool Name | Description | Sample Prompt |
| List data models that control UDM mappings in rules | "Show me all data models for log parsing" |
| Get detailed information about a specific data model | "Get the complete details for the 'AWS_CloudTrail' data model" |
Tool Name | Description | Sample Prompt |
| List available log type schemas with optional filters | "Show me all AWS-related schemas" |
| Get detailed information for specific log type schemas | "Get full details for AWS.CloudTrail schema" |
Tool Name | Description | Sample Prompt |
| Get metrics about alerts grouped by rule | "Show top 10 rules by alert count" |
| Get metrics about alerts grouped by severity | "Show alert counts by severity for the last week" |
| Get data ingestion metrics by log type and source | "Show me data ingestion volume by log type" |
Tool Name | Description | Sample Prompt |
| List all Panther user accounts with pagination support | "Show me all active Panther users" / "List the first 25 users" |
| Get detailed information about a specific user | "Get details for user ID 'john.doe@company.com'" |
| Get the current user's permissions | "What permissions do I have?" |
| List all roles with filtering options (name search, role IDs, sort direction) | "Show me all roles containing 'Admin' in the name" |
| Get detailed information about a specific role including permissions | "Get complete details for the 'Admin' role" |
Data lake SQL backends
query_data_lake uses the instance's SQL dialect (Snowflake or Databricks).
Discover names and types with list_databases, list_database_tables, and get_table_schema.
Fetch schemas before using vendor-specific fields; reuse schemas already fetched in the conversation.
Use SQL LIMIT to bound results; max_rows controls page size.
Backend |
| Example table |
Snowflake |
|
|
Databricks |
|
|
get_alert_event_stats currently requires Snowflake. On Databricks, query
panther_signals.correlation_signals through query_data_lake with
database_name="panther_signals".
Related MCP server: stepsecurity-mcp
Panther Configuration
Follow these steps to configure your API credentials and environment.
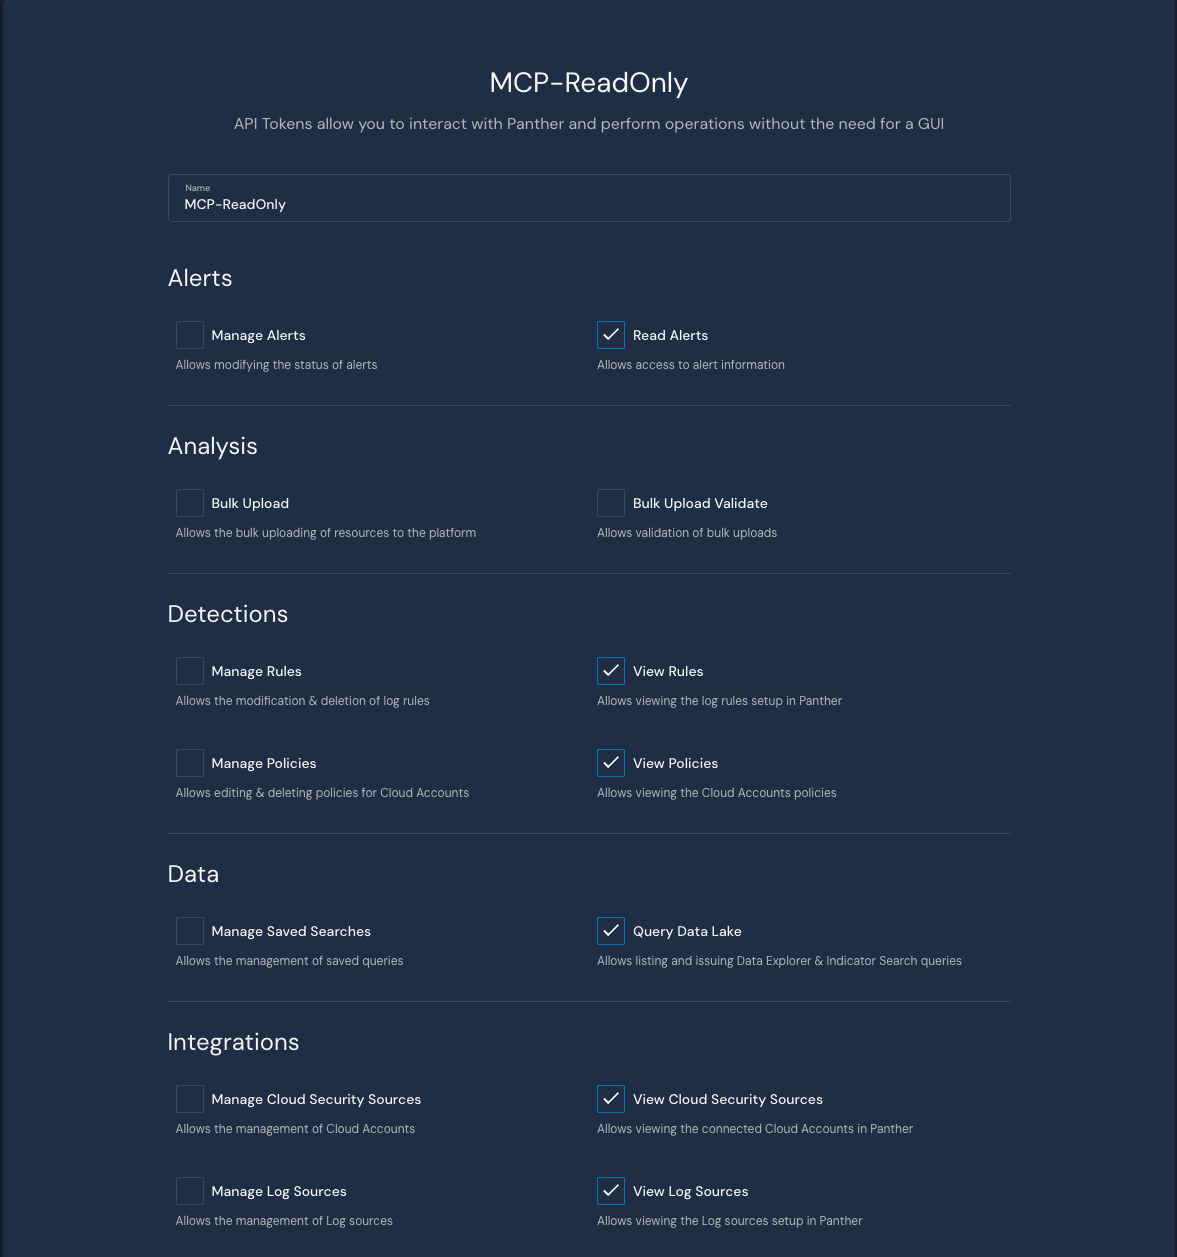
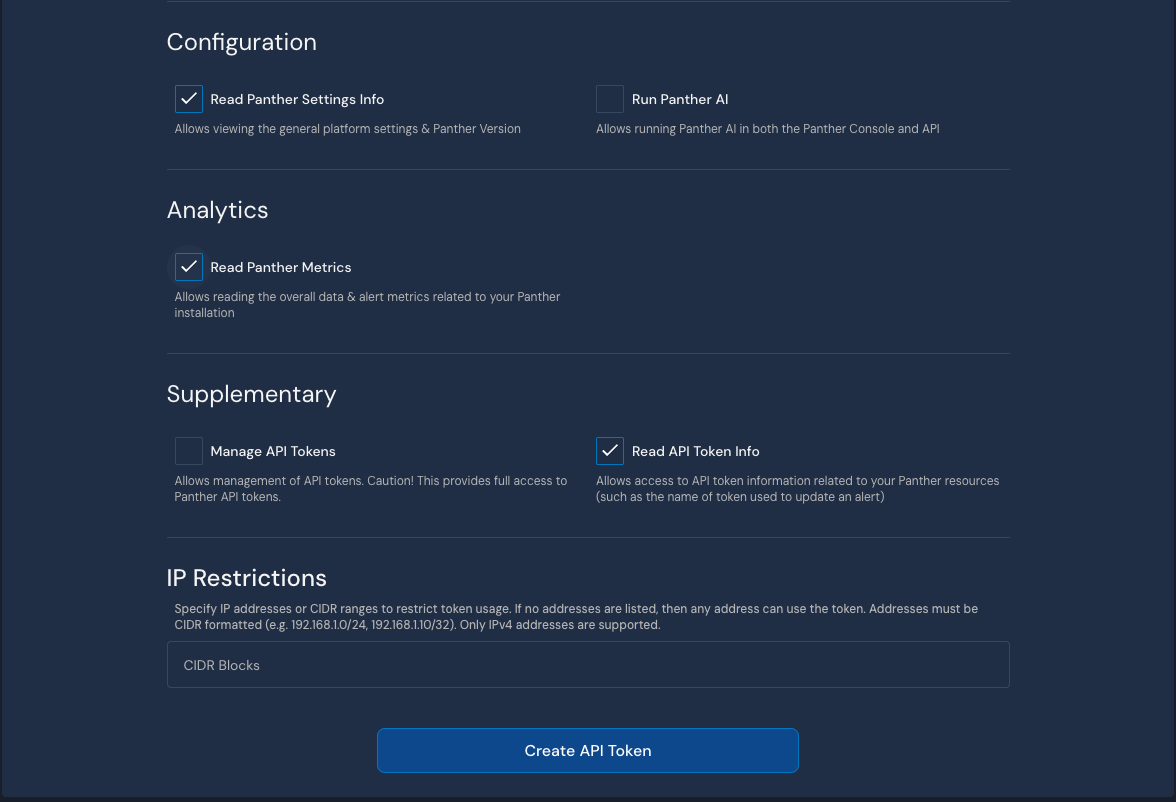
Create an API token in Panther:
Navigate to Settings (gear icon) → API Tokens
Create a new token with the following permissions (recommended read-only approach to start):

Store the generated token securely (e.g., 1Password)
Copy the Panther instance URL from your browser (e.g.,
https://YOUR-PANTHER-INSTANCE.domain)Note: This must include
https://
MCP Server Installation
Choose one of the following installation methods:
Docker (Recommended)
The easiest way to get started is using our pre-built Docker image:
{
"mcpServers": {
"mcp-panther": {
"command": "docker",
"args": [
"run",
"-i",
"-e", "PANTHER_INSTANCE_URL",
"-e", "PANTHER_API_TOKEN",
"--rm",
"ghcr.io/panther-labs/mcp-panther"
],
"env": {
"PANTHER_INSTANCE_URL": "https://YOUR-PANTHER-INSTANCE.domain",
"PANTHER_API_TOKEN": "YOUR-API-KEY"
}
}
}
}Version Pinning: For production stability, pin to a specific version tag:
"ghcr.io/panther-labs/mcp-panther:v2.2.0"Available tags can be found on the GitHub Container Registry.
UVX
For Python users, you can run directly from PyPI using uvx:
Configure your MCP client:
{
"mcpServers": {
"mcp-panther": {
"command": "uvx",
"args": ["mcp-panther"],
"env": {
"PANTHER_INSTANCE_URL": "https://YOUR-PANTHER-INSTANCE.domain",
"PANTHER_API_TOKEN": "YOUR-PANTHER-API-TOKEN"
}
}
}
}Version Pinning: For production stability, pin to a specific version:
"args": ["mcp-panther==2.2.0"]Available versions can be found on PyPI.
MCP Client Setup
Cursor
Follow the instructions here to configure your project or global MCP configuration. It's VERY IMPORTANT that you do not check this file into version control.
Once configured, navigate to Cursor Settings > MCP to view the running server:
Tips:
Be specific about where you want to generate new rules by using the
@symbol and then typing a specific directory.For more reliability during tool use, try selecting a specific model, like Claude 3.7 Sonnet.
If your MCP Client is failing to find any tools from the Panther MCP Server, try restarting the Client and ensuring the MCP server is running. In Cursor, refresh the MCP Server and start a new chat.
Claude Code
Claude Code is Anthropic's official CLI tool. Add the Panther MCP server using Docker:
claude mcp add-json panther '{
"command": "docker",
"args": [
"run",
"-i",
"-e", "PANTHER_INSTANCE_URL",
"-e", "PANTHER_API_TOKEN",
"--rm",
"ghcr.io/panther-labs/mcp-panther"
],
"env": {
"PANTHER_INSTANCE_URL": "https://YOUR-PANTHER-INSTANCE.domain",
"PANTHER_API_TOKEN": "YOUR-API-TOKEN"
}
}'Alternatively, using UVX:
claude mcp add-json panther '{
"command": "uvx",
"args": ["mcp-panther"],
"env": {
"PANTHER_INSTANCE_URL": "https://YOUR-PANTHER-INSTANCE.domain",
"PANTHER_API_TOKEN": "YOUR-API-TOKEN"
}
}'After adding, verify the server is configured:
claude mcp listClaude Desktop
To use with Claude Desktop, manually configure your claude_desktop_config.json:
Open the Claude Desktop settings and navigate to the Developer tab
Click "Edit Config" to open the configuration file
Add the following configuration:
{
"mcpServers": {
"mcp-panther": {
"command": "uvx",
"args": ["mcp-panther"],
"env": {
"PANTHER_INSTANCE_URL": "https://YOUR-PANTHER-INSTANCE.domain",
"PANTHER_API_TOKEN": "YOUR-PANTHER-API-TOKEN"
}
}
}
}Save the file and restart Claude Desktop
If you run into any issues, try the troubleshooting steps here.
Goose CLI
Use with Goose CLI, Block's open-source AI agent:
# Start Goose with the MCP server
goose session --with-extension "uvx mcp-panther"Goose Desktop
Use with Goose Desktop, Block's open-source AI agent:
From 'Extensions' -> 'Add custom extension' provide your configuration information.
Running the Server
The MCP Panther server supports multiple transport protocols:
STDIO (Default)
For local development and MCP client integration:
uv run python -m mcp_panther.serverStreamable HTTP
For running as a persistent web service, use the HTTP transport. This is ideal for:
Long-running server deployments
Multiple clients connecting to the same server
Testing and debugging with continuous log monitoring
Using Docker Run (Detached)
docker run -d \
--name panther-mcp-server \
-p 8000:8000 \
-e PANTHER_INSTANCE_URL=https://YOUR-PANTHER-INSTANCE.domain \
-e PANTHER_API_TOKEN=YOUR-API-TOKEN \
-e MCP_TRANSPORT=streamable-http \
-e MCP_HOST=0.0.0.0 \
-e MCP_PORT=8000 \
-e LOG_LEVEL=INFO \
--restart unless-stopped \
ghcr.io/panther-labs/mcp-panther:latestUsing Docker Compose (Recommended)
Create a docker-compose.yml file:
services:
panther-mcp:
image: ghcr.io/panther-labs/mcp-panther:latest
container_name: panther-mcp-server
ports:
- "8000:8000"
environment:
- PANTHER_INSTANCE_URL=https://YOUR-PANTHER-INSTANCE.domain
- PANTHER_API_TOKEN=YOUR-API-TOKEN
- MCP_TRANSPORT=streamable-http
- MCP_HOST=0.0.0.0
- MCP_PORT=8000
- LOG_LEVEL=INFO
restart: unless-stoppedStart the server:
# Start in detached mode
docker-compose up -d
# View logs
docker-compose logs -f
# Stop the server
docker-compose downConnecting Claude Code to HTTP Server
Important: The server runs on HTTP (not HTTPS). Configure Claude Code with the http:// URL:
# Add the HTTP endpoint (note: http:// not https://)
claude mcp add-json panther-http '{
"url": "http://localhost:8000/mcp"
}'
# Verify configuration
claude mcp listTesting the Connection
# Test the HTTP endpoint
curl http://localhost:8000/mcp
# View server logs
docker logs -f panther-mcp-server
# Or with docker-compose:
docker-compose logs -fYou can also test using the FastMCP client:
import asyncio
from fastmcp import Client
async def test_connection():
async with Client("http://localhost:8000/mcp") as client:
tools = await client.list_tools()
print(f"Available tools: {len(tools)}")
asyncio.run(test_connection())Troubleshooting Streamable HTTP
Port Already in Use
If you see Bind for 0.0.0.0:8000 failed: port is already allocated:
# Check what's using the port
lsof -i :8000
# Stop conflicting containers
docker ps | grep panther
docker stop <container-id>
# Or use a different port via MCP_PORT environment variable:
-e MCP_PORT=8080
# Then connect to: http://localhost:8080/mcpInvalid HTTP Request Warnings
If you see WARNING: Invalid HTTP request received in the logs, this usually means:
Claude Code is trying to connect via HTTPS instead of HTTP
Check your configuration uses
http://nothttps://Verify with:
claude mcp list
Environment Variables
MCP_TRANSPORT: Set transport type (stdioorstreamable-http)MCP_PORT: Port for HTTP transport (default: 3000)MCP_HOST: Host for HTTP transport (default: 127.0.0.1)MCP_LOG_FILE: Log file path (optional)MCP_MAX_RESULT_SIZE_CHARS: Advertise_meta["anthropic/maxResultSizeChars"]on every tool, so Claude Code returns text results up to this many characters inline instead of saving them to a file (optional; Claude Code accepts up to 500,000)
Security Best Practices
We highly recommends the following MCP security best practices:
Apply strict least-privilege to Panther API tokens. Scope tokens to the minimal permissions required and bind them to an IP allow-list or CIDR range so they're useless if exfiltrated. Rotate credentials on a preferred interval (e.g., every 30d).
Host the MCP server in a locked-down sandbox (e.g., Docker) with read-only mounts. This confines any compromise to a minimal blast radius.
Monitor credential access to Panther and monitor for anomalies. Write a Panther rule!
Run only trusted, officially signed MCP servers. Verify digital signatures or checksums before running, audit the tool code, and avoid community tools from unofficial publishers.
Troubleshooting
Check the server logs for detailed error messages: tail -n 20 -F ~/Library/Logs/Claude/mcp*.log. Common issues and solutions are listed below.
Running tools
If you get a
{"success": false, "message": "Failed to [action]: Request failed (HTTP 403): {\"error\": \"forbidden\"}"}error, it likely means your API token lacks the particular permission needed by the tool.Ensure your Panther Instance URL is correctly set. You can view this in the
config://pantherresource from your MCP Client.
Contributing
We welcome contributions to improve MCP-Panther! Here's how you can help:
Report Issues: Open an issue for any bugs or feature requests
Submit Pull Requests: Fork the repository and submit PRs for bug fixes or new features
Improve Documentation: Help us make the documentation clearer and more comprehensive
Share Use Cases: Let us know how you're using MCP-Panther and what could make it better
Please ensure your contributions follow our coding standards and include appropriate tests and documentation.
Contributors
This project exists thanks to all the people who contribute. Special thanks to Tomasz Tchorz and Glenn Edwards from Block, who played a core role in launching MCP-Panther as a joint open-source effort with Panther.
See our CONTRIBUTORS.md for a complete list of contributors.
License
This project is licensed under the Apache License 2.0 - see the LICENSE file for details.
Available Tools
36 toolsadd_alert_commentADestructive
Add a comment to a Panther alert. Comments support Markdown formatting.
Returns: Dict containing: - success: Boolean indicating if the comment was added successfully - comment: Created comment information if successful - message: Error message if unsuccessful
Permissions:{'all_of': ['Manage Alerts']}
Inputs: alert_id (required), comment (required). Returns: object
bulk_update_alertsADestructiveIdempotent
Bulk update multiple alerts with status, assignee, and/or comment changes.
This tool allows you to efficiently update multiple alerts at once by setting their status, assignee, and adding a comment. At least one of status, assignee_id, or comment must be provided.
Returns: Dict containing: - success: Boolean indicating overall success - results: Dict with operation results: - status_updates: List of alert IDs successfully updated with new status - assignee_updates: List of alert IDs successfully updated with new assignee - comments_added: List of alert IDs that successfully received comments - failed_operations: List of failed operations with error details - summary: Dict with counts of successful and failed operations - message: Error message if unsuccessful
Permissions:{'all_of': ['Manage Alerts']}
Inputs: alert_ids (required), status, assignee_id, comment. Returns: object
disable_detectionADestructiveIdempotent
Disable a Panther detection by setting enabled to false.
Permissions:{'any_of': ['Manage Rules', 'Manage Policies']}
Inputs: detection_id (required), detection_type. Returns: object
get_ai_alert_triage_summaryARead-only
Retrieve the latest AI triage summary for a specific Panther alert.
This tool retrieves the most recently generated AI triage analysis for an alert. It fetches the list of AI inference stream IDs associated with the alert, then retrieves the response text for the latest stream.
Returns: Dict containing: - success: Boolean indicating if retrieval was successful - summary: The latest AI triage summary containing: - stream_id: The unique stream identifier - response_text: The AI-generated triage summary - finished: Whether the triage generation completed - error: Any error message if present - message: Error message if unsuccessful
Permissions:{'all_of': ['Run Panther AI']}
Inputs: alert_id (required). Returns: object
get_alertARead-only
Get detailed information about a specific Panther alert by ID
Permissions:{'all_of': ['Read Alerts']}
Inputs: alert_id (required). Returns: object
get_alert_eventsARead-only
Get events for a specific Panther alert. Order of events is not guaranteed. This tool does not support pagination to prevent long-running, expensive queries.
Returns: Dict containing: - success: Boolean indicating if the request was successful - events: List of most recent events if successful - message: Error message if unsuccessful
Permissions:{'all_of': ['Read Alerts']}
Inputs: alert_id (required), limit. Returns: object
get_alert_event_statsARead-only
Analyze patterns and relationships across multiple alerts by aggregating their event data into time-based groups.
For each time window (configurable from 1-60 minutes), the tool collects unique entities (IPs, emails, usernames, trace IDs) and alert metadata (IDs, rules, severities) to help identify related activities.
Results are ordered chronologically with the most recent first, helping analysts identify temporal patterns, common entities, and potential incident scope.
Returns: Dict containing: - success: Boolean indicating if the query was successful - status: Status of the query (e.g., "succeeded", "failed", "cancelled") - message: Error message if unsuccessful - results: List of query result rows - column_info: Dict containing column names and types - stats: Dict containing stats about the query - has_next_page: Boolean indicating if there are more results available - next_cursor: Cursor for fetching the next page of results, or null if no more pages
Permissions:{'all_of': ['Query Data Lake']}
Inputs: alert_ids (required), time_window, start_date, end_date. Returns: object
get_bytes_processed_metricsBRead-only
Retrieves data ingestion metrics showing total bytes processed per log type and source, helping analyze data volume patterns.
Returns: Dict: - success: Boolean indicating if the query was successful - bytes_processed: List of series with breakdown by log type and source - total_bytes: Total bytes processed in the period - start_date: Start date of the period - end_date: End date of the period - interval_in_minutes: Grouping interval for the metrics
Permissions:{'all_of': ['Read Panther Metrics']}
Inputs: start_date, end_date, interval_in_minutes. Returns: object
get_data_modelBRead-only
Get detailed information about a Panther data model, including the mappings and body
Returns complete data model information including Python body code and UDM mappings.
Permissions:{'all_of': ['View Rules']}
Inputs: data_model_id (required). Returns: object
get_detectionBRead-only
Get detailed information about a Panther detection, including the detection body and tests.
Permissions:{'all_of': ['View Rules', 'View Policies']}
Inputs: detection_id (required), detection_type. Returns: object
get_global_helperARead-only
Get detailed information about a Panther global helper by ID
Returns complete global helper information including Python body code and usage details.
Permissions:{'all_of': ['View Rules']}
Inputs: helper_id (required). Returns: object
get_http_log_sourceARead-only
Get detailed information about a specific HTTP log source by ID.
HTTP log sources are used to collect logs via HTTP endpoints/webhooks. This tool provides detailed configuration information for troubleshooting and monitoring HTTP log source integrations.
Args: source_id: The ID of the HTTP log source to retrieve
Returns: Dict containing: - success: Boolean indicating if the query was successful - source: HTTP log source information if successful, containing: - integrationId: The source ID - integrationLabel: The source name/label - logTypes: List of log types this source handles - logStreamType: Stream type (Auto, JSON, JsonArray, etc.) - logStreamTypeOptions: Additional stream type configuration - authMethod: Authentication method (None, Bearer, Basic, etc.) - authBearerToken: Bearer token if using Bearer auth - authUsername: Username if using Basic auth - authPassword: Password if using Basic auth - authHeaderKey: Header key for HMAC/SharedSecret auth - authSecretValue: Secret value for HMAC/SharedSecret auth - authHmacAlg: HMAC algorithm if using HMAC auth - message: Error message if unsuccessful
Permissions:{'all_of': ['View Log Sources']}
Inputs: source_id (required). Returns: object
get_log_type_schema_detailsARead-only
Get detailed information for specific log type schemas, including their full specifications. Limited to 5 schemas at a time to prevent response size issues.
Returns: Dict containing: - success: Boolean indicating if the query was successful - schemas: List of schemas, each containing: - name: Schema name (Log Type) - description: Schema description - spec: Schema specification in YAML/JSON format - version: Schema version number - revision: Schema revision number - isArchived: Whether the schema is archived - isManaged: Whether the schema is managed by a pack - isFieldDiscoveryEnabled: Whether automatic field discovery is enabled - referenceURL: Optional documentation URL - discoveredSpec: The schema discovered spec - createdAt: Creation timestamp - updatedAt: Last update timestamp - message: Error message if unsuccessful
Permissions:{'all_of': ['View Rules']}
Inputs: schema_names (required). Returns: object
get_permissionsARead-only
Get the current user's permissions. Use this to diagnose permission errors and determine if a new API token is needed.
Inputs: no named parameters. Returns: object
get_roleARead-only
Get detailed information about a Panther role by ID
Returns complete role information including all permissions and settings.
Permissions:{'all_of': ['Read User Info']}
Inputs: role_id (required). Returns: object
get_rule_alert_metricsARead-only
Gets alert metrics grouped by detection rule for ALL alert types, including alerts, detection errors, and system errors within a given time period. Use this tool to identify hot spots in alerts and use list_alerts for specific alert details.
Returns: Dict: - alerts_per_rule: List of series with entityId, label, and value - total_alerts: Total number of alerts in the period - start_date: Start date of the period - end_date: End date of the period - interval_in_minutes: Grouping interval for the metrics - rule_ids: List of rule IDs if provided
Permissions:{'all_of': ['Read Panther Metrics']}
Inputs: start_date, end_date, interval_in_minutes, rule_ids. Returns: object
get_scheduled_queryARead-only
Get detailed information about a specific scheduled query by ID.
Returns complete scheduled query information including SQL, schedule configuration, and metadata.
Returns: Dict containing: - success: Boolean indicating if the query was successful - query: Scheduled query information if successful, containing: - id: Query ID - name: Query name - description: Query description - sql: The SQL query text - schedule: Schedule configuration (cron, rate, timeout) - managed: Whether the query is managed by Panther - createdAt: Creation timestamp - updatedAt: Last update timestamp - message: Error message if unsuccessful
Permissions:{'all_of': ['Query Data Lake']}
Inputs: query_id (required). Returns: object
get_severity_alert_metricsARead-only
Gets alert metrics grouped by severity for rule and policy alert types within a given time period. Use this tool to identify hot spots in your alerts, and use the list_alerts tool for specific details. Keep in mind that these metrics combine errors and alerts, so there may be inconsistencies from what list_alerts returns.
Returns: Dict: - alerts_per_severity: List of series with breakdown by severity - total_alerts: Total number of alerts in the period - start_date: Start date of the period - end_date: End date of the period - interval_in_minutes: Grouping interval for the metrics
Permissions:{'all_of': ['Read Panther Metrics']}
Inputs: start_date, end_date, alert_types, severities, +1 more. Returns: object
get_table_schemaARead-only
Get column details for a specific data lake table.
IMPORTANT: This returns the table structure in Snowflake. For writing optimal queries, ALSO call get_panther_log_type_schema() to understand:
Nested object structures (only shown as 'object' type here)
Which fields map to p_any_* indicator columns
Array element structures
Example workflow:
get_panther_log_type_schema(["AWS.CloudTrail"]) - understand structure
get_table_schema("panther_logs.public", "aws_cloudtrail") - get column names/types
Write query using both: nested paths from log schema, column names from table schema
Returns: Dict containing: - success: Boolean indicating if the query was successful - name: Table name - display_name: Table display name - description: Table description - log_type: Log type - columns: List of columns, each containing: - name: Column name - type: Column data type - description: Column description - message: Error message if unsuccessful
Permissions:{'all_of': ['Query Data Lake']}
Inputs: database_name (required), table_name (required). Returns: object
get_userARead-only
Get detailed information about a Panther user by ID
Returns complete user information including email, names, role, authentication status, and timestamps.
Permissions:{'all_of': ['Read User Info']}
Inputs: user_id (required). Returns: object
list_alert_commentsARead-only
Get all comments for a specific Panther alert.
Returns: Dict containing: - success: Boolean indicating if the request was successful - comments: List of comments if successful, each containing: - id: The comment ID - body: The comment text - createdAt: Timestamp when the comment was created - createdBy: Information about the user who created the comment - format: The format of the comment (HTML or PLAIN_TEXT or JSON_SCHEMA) - message: Error message if unsuccessful
Permissions:{'all_of': ['Read Alerts']}
Inputs: alert_id (required), limit. Returns: object
list_alertsARead-only
List alerts from Panther with comprehensive filtering options
Args: start_date: Optional start date in ISO 8601 format (e.g. "2024-03-20T00:00:00Z") end_date: Optional end date in ISO 8601 format (e.g. "2024-03-21T00:00:00Z") severities: Optional list of severities to filter by (e.g. ["CRITICAL", "HIGH", "MEDIUM", "LOW", "INFO"]) statuses: Optional list of statuses to filter by (e.g. ["OPEN", "TRIAGED", "RESOLVED", "CLOSED"]) cursor: Optional cursor for pagination from a previous query detection_id: Optional detection ID to filter alerts by. If not provided, default date range (7days) is applied. event_count_max: Optional maximum number of events that returned alerts must have event_count_min: Optional minimum number of events that returned alerts must have log_sources: Optional list of log source IDs to filter alerts by log_types: Optional list of log type names to filter alerts by name_contains: Optional string to search for in alert titles page_size: Number of results per page (default: 25, maximum: 50) resource_types: Optional list of AWS resource type names to filter alerts by subtypes: Optional list of alert subtypes. Valid values depend on alert_type: - When alert_type="ALERT": ["POLICY", "RULE", "SCHEDULED_RULE"] - When alert_type="DETECTION_ERROR": ["RULE_ERROR", "SCHEDULED_RULE_ERROR"] - When alert_type="SYSTEM_ERROR": subtypes are not allowed alert_type: Type of alerts to return (default: "ALERT"). One of: - "ALERT": Regular detection alerts - "DETECTION_ERROR": Alerts from detection errors - "SYSTEM_ERROR": System error alerts
Permissions:{'all_of': ['Read Alerts']}
Inputs: start_date, end_date, severities, statuses, +11 more. Returns: object
list_databasesARead-only
List all available datalake databases in Panther.
Returns: Dict containing: - success: Boolean indicating if the query was successful - databases: List of databases, each containing: - name: Database name - description: Database description - message: Error message if unsuccessful
Permissions:{'all_of': ['Query Data Lake']}
Inputs: no named parameters. Returns: object
list_database_tablesARead-only
List all available tables in a Panther Database.
Required: Only use valid database names obtained from list_databases
Returns: Dict containing: - success: Boolean indicating if the query was successful - tables: List of tables, each containing: - name: Table name - description: Table description - log_type: Log type - database: Database name - message: Error message if unsuccessful
Permissions:{'all_of': ['Query Data Lake']}
Inputs: database (required). Returns: object
list_data_modelsARead-only
List all data models from your Panther instance. Data models are used only in Panther's Python rules to map log type schema fields to a unified data model. They may also contain custom mappings for fields that are not part of the log type schema.
Returns paginated list of data models with metadata including mappings and log types.
Permissions:{'all_of': ['View Rules']}
Inputs: cursor, limit. Returns: object
list_detectionsARead-only
List detections from your Panther instance with support for multiple detection types and filtering.
Note: The output_ids filter is applied client-side after fetching all results from the API, as the Panther REST API does not support server-side filtering by outputID. For more efficient API-level filtering, consider using the 'tag' parameter if your detections are tagged by environment.
Permissions:{'all_of': ['View Rules', 'View Policies']}
Inputs: detection_types, cursor, limit, name_contains, +9 more. Returns: object
list_global_helpersARead-only
List all global helpers from your Panther instance. Global helpers are shared Python functions that can be used across multiple rules, policies, and other detections.
Returns paginated list of global helpers with metadata including descriptions and code.
Permissions:{'all_of': ['View Rules']}
Inputs: cursor, limit, name_contains, created_by, +1 more. Returns: object
list_log_sourcesARead-only
List log sources from Panther with optional filters.
Permissions:{'all_of': ['View Rules']}
Inputs: cursor, log_types, is_healthy, integration_type. Returns: object
list_log_type_schemasARead-only
List all available log type schemas in Panther. Schemas are transformation instructions that convert raw audit logs into structured data for the data lake and real-time Python rules.
Returns: Dict containing: - success: Boolean indicating if the query was successful - schemas: List of schemas, each containing: - name: Schema name (Log Type) - description: Schema description - revision: Schema revision number - isArchived: Whether the schema is archived - isManaged: Whether the schema is managed by a pack - referenceURL: Optional documentation URL - createdAt: Creation timestamp - updatedAt: Last update timestamp - message: Error message if unsuccessful
Permissions:{'all_of': ['View Log Sources']}
Inputs: contains, is_archived, is_in_use, is_managed. Returns: object
list_rolesARead-only
List all roles from your Panther instance.
Returns list of roles with metadata including permissions and settings.
Permissions:{'all_of': ['Read User Info']}
Inputs: name_contains, name, role_ids, sort_dir. Returns: object
list_scheduled_queriesARead-only
List all scheduled queries from your Panther instance.
Scheduled queries are SQL queries that run automatically on a defined schedule for recurring analysis, reporting, and monitoring tasks.
Note: SQL content is excluded from list responses to prevent token limits. Use get_scheduled_query() to retrieve the full SQL for a specific query.
Returns: Dict containing: - success: Boolean indicating if the query was successful - queries: List of scheduled queries if successful, each containing: - id: Query ID - name: Query name - description: Query description - schedule: Schedule configuration (cron, rate, timeout) - managed: Whether the query is managed by Panther - createdAt: Creation timestamp - updatedAt: Last update timestamp - total_queries: Number of queries returned - has_next_page: Boolean indicating if more results are available - next_cursor: Cursor for fetching the next page of results - message: Error message if unsuccessful
Permissions:{'all_of': ['Query Data Lake']}
Inputs: cursor, limit, name_contains. Returns: object
list_usersARead-only
List all Panther user accounts.
Returns: Dict containing: - success: Boolean indicating if the query was successful - users: List of user accounts if successful - total_users: Number of users returned - has_next_page: Boolean indicating if more results are available - next_cursor: Cursor for fetching the next page of results - message: Error message if unsuccessful
Permissions:{'all_of': ['Read User Info']}
Inputs: cursor, limit. Returns: object
query_data_lakeARead-only
Query Panther's security data lake using SQL for log analysis and threat hunting.
REQUIRED: Include time filter with p_event_time (required for performance and partitioning)
Panther Time Filter Macros (Recommended - optimized for performance):
p_occurs_since(timeOffset [, tableAlias[, column]]) Examples: p_occurs_since('1 d'), p_occurs_since('6 h'), p_occurs_since('2 weeks'), p_occurs_since(3600) Time formats: '30 s', '15 m', '6 h', '2 d', '1 w' OR '2 weeks', '1 day' OR numeric seconds
p_occurs_between(startTime, endTime [, tableAlias[, column]]) Examples: p_occurs_between('2024-01-01', '2024-01-02'), p_occurs_between('2024-03-20T00:00:00Z', '2024-03-20T23:59:59Z')
p_occurs_around(timestamp, timeOffset [, tableAlias[, column]]) Example: p_occurs_around('2024-01-15T10:30:00Z', '1 h') # ±1 hour around timestamp
p_occurs_after(timestamp [, tableAlias[, column]])
p_occurs_before(timestamp [, tableAlias[, column]])
Alternative (manual): WHERE p_event_time >= '2024-01-01' AND p_event_time < '2024-01-02'
Best Practices:
Always use time filters (macros preferred over manual p_event_time conditions)
Start with summary queries, then drill down to specific timeframes
Use p_any_* fields for faster correlation (p_any_ip_addresses, p_any_usernames, p_any_emails)
Query specific fields instead of SELECT * for better performance
Pagination:
First call: No cursor parameter - returns first page with max_rows results
Subsequent calls: Use next_cursor from previous response to get next page
Continue until has_next_page is False
Common Examples:
Recent failed logins: "SELECT * FROM panther_logs.public.aws_cloudtrail WHERE p_occurs_since('1 d') AND errorcode IS NOT NULL"
IP activity summary: "SELECT sourceippaddress, COUNT(*) FROM panther_logs.public.aws_cloudtrail WHERE p_occurs_since('6 h') GROUP BY sourceippaddress"
User correlation: "SELECT * FROM panther_logs.public.aws_cloudtrail WHERE p_occurs_since('2 h') AND ARRAY_CONTAINS('user@domain.com'::VARIANT, p_any_emails)"
Nested field access: "SELECT p_enrichment:ipinfo_privacy:"context.ip_address" FROM table WHERE p_occurs_since('1 h')"
Query Syntax (Snowflake SQL):
Access nested JSON: column:field.subfield
Quote special characters: column:"field name" or p_enrichment:"context.ip_address"
Array searches: ARRAY_CONTAINS('value'::VARIANT, array_column)
Returns: Dict with query results: - results: List of matching rows (paginated based on cursor parameter) - results_truncated: True if results were truncated (only for non-paginated requests) - total_rows_available: Total rows found (for non-paginated requests) - has_next_page: True if more results are available - next_cursor: Cursor for next page (use in subsequent call) - column_info: Column names and data types - stats: Query performance metrics (execution time, bytes scanned) - success/status/message: Query execution status
Permissions:{'all_of': ['Query Data Lake']}
Inputs: sql (required), database_name, timeout, max_rows, +1 more. Returns: object
start_ai_alert_triageARead-only
Start an AI-powered triage analysis for a Panther alert with intelligent insights and recommendations.
This tool initiates Panther's embedded AI agent to triage an alert and provide an intelligent report about the events, risk level, potential impact, and recommended next steps for investigation.
The AI triage includes analysis of:
Alert metadata (severity, detection rule, timestamps)
Related events and logs (if available)
Comments from previous investigations
Contextual security analysis and recommendations
Returns: Dict containing: - success: Boolean indicating if triage was generated successfully - summary: The AI-generated triage summary text - stream_id: The stream ID used for this analysis - metadata: Information about the analysis request - message: Error message if unsuccessful
Permissions:{'all_of': ['Run Panther AI']}
Inputs: alert_id (required), prompt, timeout_seconds. Returns: object
update_alert_assigneeADestructiveIdempotent
Update the assignee of one or more alerts through the assignee's ID.
Returns: Dict containing: - success: Boolean indicating if the update was successful - alerts: List of updated alert IDs if successful - message: Error message if unsuccessful
Permissions:{'all_of': ['Manage Alerts']}
Inputs: alert_ids (required), assignee_id (required). Returns: object
update_alert_statusADestructiveIdempotent
Update the status of one or more Panther alerts.
Returns: Dict containing: - success: Boolean indicating if the update was successful - alerts: List of updated alert IDs if successful - message: Error message if unsuccessful
Permissions:{'all_of': ['Manage Alerts']}
Inputs: alert_ids (required), status (required). Returns: object
Tool Schema Changelog
Recent tool additions, removals, and schema changes observed during successful MCP inspections.
Loading tool schema changelog…
TDQS
Scored across 36 tools
Most tools have distinct purposes targeting specific resources (alerts, detections, schemas, queries, etc.), but there is some overlap between get_alert_events and get_alert_event_stats (both analyze alert events), and between various metric tools like get_rule_alert_metrics and get_severity_alert_metrics. Descriptions help clarify differences, but an agent might initially confuse these pairs.
Tool names follow a highly consistent verb_noun pattern throughout, with clear prefixes like get_, list_, add_, update_, bulk_update_, disable_, start_, and query_. All names use snake_case consistently, making them predictable and readable across the entire set.
With 36 tools, the count feels heavy for a single server, though Panther is a comprehensive security platform. The tools cover alerts, detections, data lake, schemas, users, roles, and AI triage, which justifies breadth, but it may overwhelm agents with too many options for common workflows.
The tool set provides complete CRUD/lifecycle coverage for Panther's domain: alert management (list, get, update, comment, bulk update, AI triage), detection handling (list, get, disable), data lake querying and schema inspection, user/role management, and metric retrieval. No obvious gaps exist; agents can perform end-to-end security operations.
Maintenance
Related MCP Connectors
Official Microsoft MCP Server to query Microsoft Entra data using natural language
Official Miro MCP server - Supports context to code and creating diagrams, docs, and data tables.
Official MCP server for Qase — manage test cases, runs, suites, defects via AI tools.
Official MCP server for twitterapis.com. Twitter/X search, users, DMs, Grok, monitoring and writes.
Related MCP Servers
- AlicenseBqualityBmaintenanceAn MCP server for the Wazuh SIEM/XDR platform that enables users to query agents, security alerts, detection rules, and decoders through Claude or other MCP clients. It provides specialized tools and prompts for investigating security alerts, performing agent health checks, and generating environmental security overviews.2878 npm9MIT

stepsecurity-mcpofficial
AlicenseAqualityDmaintenanceMCP server for the StepSecurity platform that enables investigating supply-chain and CI/CD security issues through natural language.30120 npm5Apache 2.0- AlicenseAqualityCmaintenanceOfficial MCP server for the Perplexity API Platform, enabling AI assistants to perform real-time web search, reasoning, and deep research using Sonar models.447,808 npmMIT
- AlicenseAqualityCmaintenanceOfficial MCP server for interacting with Saudi market data (Sahmk) via natural language queries, enabling stock quotes, company info, and market summaries inside AI agents like Cursor and Claude Desktop.1515MIT