
The Optuna MCP Server enables automated hyperparameter optimization and analysis through LLMs by providing access to Optuna's capabilities via the Model Context Protocol.
Core Capabilities:
Study Management: Create and manage studies with configurable optimization directions (minimize/maximize), define samplers (TPESampler, NSGAIISampler, RandomSampler, GPSampler), set metric names for multi-objective optimization, and retrieve study information
Trial Operations: Request suggested parameters using Optuna's distribution system (ask), report objective values (tell), manually add single or batch trials, and manage trial metadata through user attributes
Results Analysis: Retrieve all trials in CSV format, find the best trial for single-objective optimization, or get trials on the Pareto front for multi-objective problems
Visualization: Generate plots including optimization history, hypervolume history, Pareto front, contour maps, parallel coordinates, slice plots, parameter importances, EDF plots, timeline, and rank plots
Interactive Analysis: Launch the Optuna dashboard (default port 58080) for web-based interactive study analysis
Persistent Storage: Support for SQLite and other storage backends to maintain optimization history
Use Cases:
Automated hyperparameter optimization for ML models guided by LLMs
Interactive optimization and result analysis via chat interfaces
Optimizing parameters for other MCP tools and applications (FFmpeg encoding, matplotlib configurations, recipes)
Multi-objective optimization with Pareto front analysis
Enables running the Optuna MCP server in a containerized environment with volume mounting for persistence of optimization results.
Provides tools for optimizing FFmpeg encoding parameters to maximize video quality while balancing encoding time.
Allows use of JavaScript interpreter to calculate objective values for optimization problems.
Integrates with Python environment, offering access to Optuna's hyperparameter optimization capabilities through a standardized interface.
Click on "Install Server".
Wait a few minutes for the server to deploy. Once ready, it will show a "Started" state.
In the chat, type
@followed by the MCP server name and your instructions, e.g., "@Optuna MCP Servercreate a study named 'xgboost_tuning' to minimize validation loss"
That's it! The server will respond to your query, and you can continue using it as needed.
Here is a step-by-step guide with screenshots.
Optuna MCP Server


A Model Context Protocol (MCP) server that automates optimization and analysis using Optuna.
Use Cases
The Optuna MCP Server can be used in the following use cases, for example.
Automated hyperparameter optimization by LLMs
Interactive analysis of Optuna's optimization results via chat interface
Optimize input and output of other MCP tools
For details, see the Examples section.
Related MCP server: MCP Base
Installation
The Optuna MCP server can be installed using uv or Docker.
This section explains how to install the Optuna MCP server, using Claude Desktop as an example MCP client.
Usage with uv
Before starting the installation process, install uv from Astral.
Then, add the Optuna MCP server configuration to the MCP client.
To include it in Claude Desktop, go to Claude > Settings > Developer > Edit Config > claude_desktop_config.json
and add the following:
Additionally, you can specify the Optuna storage with the --storage argument to persist the results.
After adding this, please restart Claude Desktop application. For more information about Claude Desktop, check out the quickstart page.
Usage with Docker
You can also run the Optuna MCP server using Docker. Make sure you have Docker installed and running on your machine.
Tools provided by Optuna MCP
The Optuna MCP provides the following tools. Specifically, it offers primitive functions of Optuna such as Study, Trial, Visualization, and Dashboard. Since MCP clients know the list of tools and the details of each tool, users do not need to remember those details.
Study
create_study - Create a new Optuna study with the given study_name and directions. If the study already exists, it will be simply loaded.
study_name: name of the study (string, required).directions: The directions of optimization (list of literal strings minimize/maximize, optional).
set_sampler - Set the sampler for the study.
name: the name of the sampler (string, required).
get_all_study_names - Get all study names from the storage.
set_metric_names - Set metric_names. Metric_names are labels used to distinguish what each objective value is.
metric_names: The list of metric names for each objective (list of strings, required).
get_metric_names - Get metric_names.
No parameters required.
get_directions - Get the directions of the study.
No parameters required.
get_trials - Get all trials in a CSV format.
No parameters required.
best_trial - Get the best trial.
No parameters required.
best_trials - Return trials located at the Pareto front in the study.
No parameters required.
Trial
ask - Suggest new parameters using Optuna.
search_space: the search space for Optuna (dictionary, required).
tell - Report the result of a trial.
trial_number: the trial number (integer, required).values: the result of the trial (float or list of floats, required).
set_trial_user_attr - Set user attributes for a trial.
trial_number: the trial number (integer, required).key: the key of the user attribute (string, required).value: the value of the user attribute (any type, required).
get_trial_user_attrs - Get user attributes in a trial.
trial_number: the trial number (integer, required).
Visualization
plot_optimization_history - Return the optimization history plot as an image.
target: index to specify which value to display (integer, optional).target_name: target’s name to display on the axis label (string, optional).
plot_hypervolume_history - Return the hypervolume history plot as an image.
reference_point: a list of reference points to calculate the hypervolume (list of floats, required).
plot_pareto_front - Return the Pareto front plot as an image for multi-objective optimization.
target_names: objective name list used as the axis titles (list of strings, optional).include_dominated_trials: a flag to include all dominated trial's objective values (boolean, optional).targets: a list of indices to specify the objective values to display. (list of integers, optional).
plot_contour - Return the contour plot as an image.
params: parameter list to visualize (list of strings, optional).target: an index to specify the value to display (integer, required).target_name: target’s name to display on the color bar (string, required).
plot_parallel_coordinate - Return the parallel coordinate plot as an image.
params: parameter list to visualize (list of strings, optional).target: an index to specify the value to display (integer, required).target_name: target’s name to display on the axis label and the legend (string, required).
plot_slice - Return the slice plot as an image.
params: parameter list to visualize (list of strings, optional).target: an index to specify the value to display (integer, required).target_name: target’s name to display on the axis label (string, required).
plot_param_importances - Return the parameter importances plot as an image.
params: parameter list to visualize (list of strings, optional).target: an index to specify the value to display (integer/null, optional).target_name: target’s name to display on the legend (string, required).
plot_edf - Return the EDF plot as an image.
target: an index to specify the value to display (integer, required).target_name: target’s name to display on the axis label (string, required).
plot_timeline - Return the timeline plot as an image.
No parameters required.
plot_rank - Return the rank plot as an image.
params: parameter list to visualize (list of strings, optional).target: an index to specify the value to display (integer, required).target_name: target’s name to display on the color bar (string, required).
Web Dashboard
launch_optuna_dashboard - Launch the Optuna dashboard.
port: server port (integer, optional, default: 58080).
Examples
Optimizing the 2D-Sphere Function
Here we present a simple example of optimizing the 2D-Sphere function, along with example prompts and the summary of the LLM responses.
User prompt | Output in Claude |
(Launch Claude Desktop) | |
Please create an Optuna study named "Optimize-2D-Sphere" for minimization. | |
Please suggest two float parameters x, y in [-1, 1]. | |
Please report the objective value x**2 + y**2. To calculate the value, please use the JavaScript interpreter and do not round the values. | |
Please suggest another parameter set and evaluate it. | |
Please plot the optimization history so far. |
Starting the Optuna Dashboard and Analyzing Optimization Results
You can also start the Optuna dashboard via the MCP server to analyze the optimization results interactively.
User prompt | Output in Claude |
Please launch the Optuna dashboard. |
By default, the Optuna dashboard will be launched on port 58080.
You can access it by navigating to http://localhost:58080 in your web browser as shown below:
Optuna dashboard provides various visualizations to analyze the optimization results, such as optimization history, parameter importances, and more.
Optimizing the FFmpeg Encoding Parameters
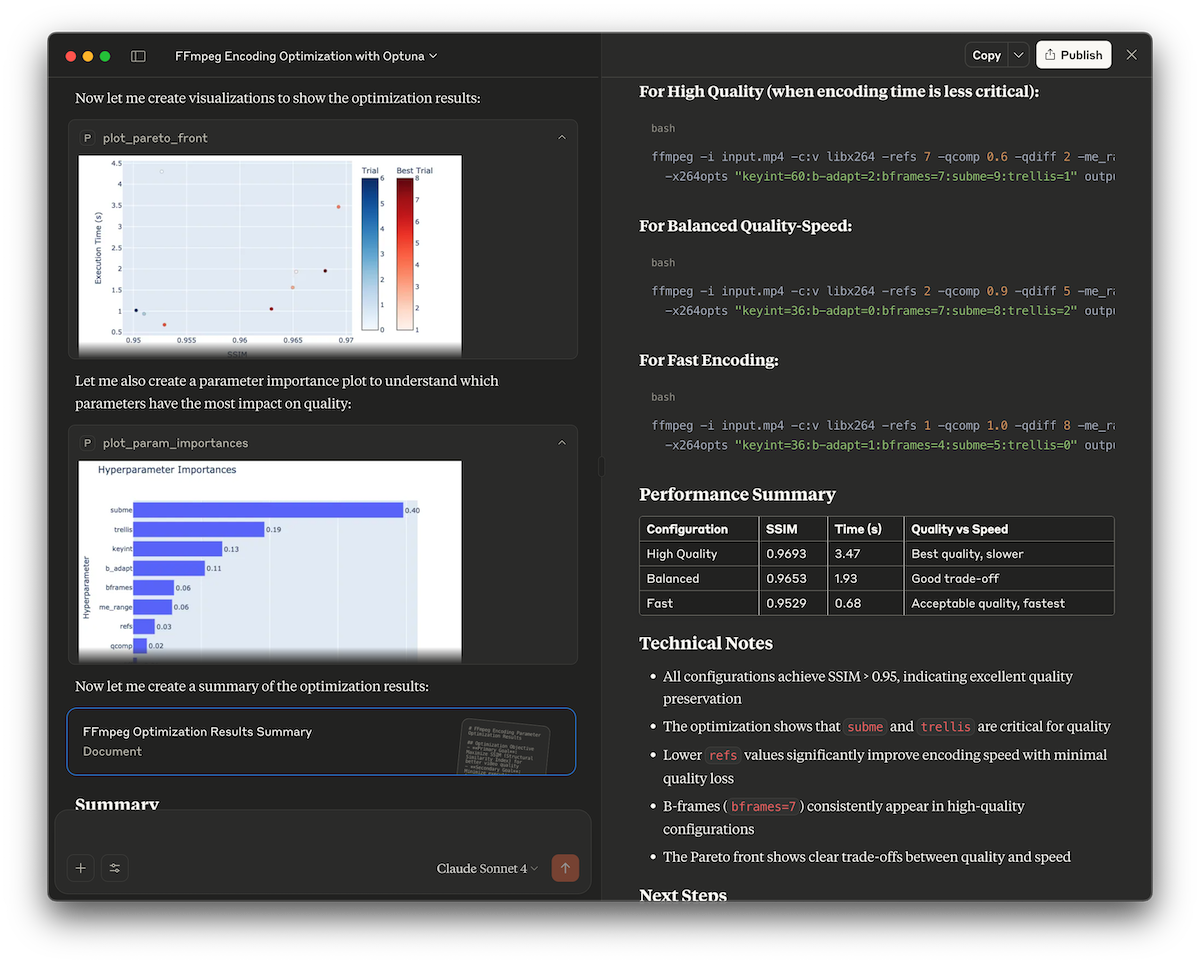
This demo showcases how to use the Optuna MCP server to automatically find optimal FFmpeg encoding parameters. It optimizes x264 encoding options to maximize video quality (measured by the SSIM score) while keeping encoding time reasonable.
Check out examples/ffmpeg for details.
Optimizing the Cookie Recipe
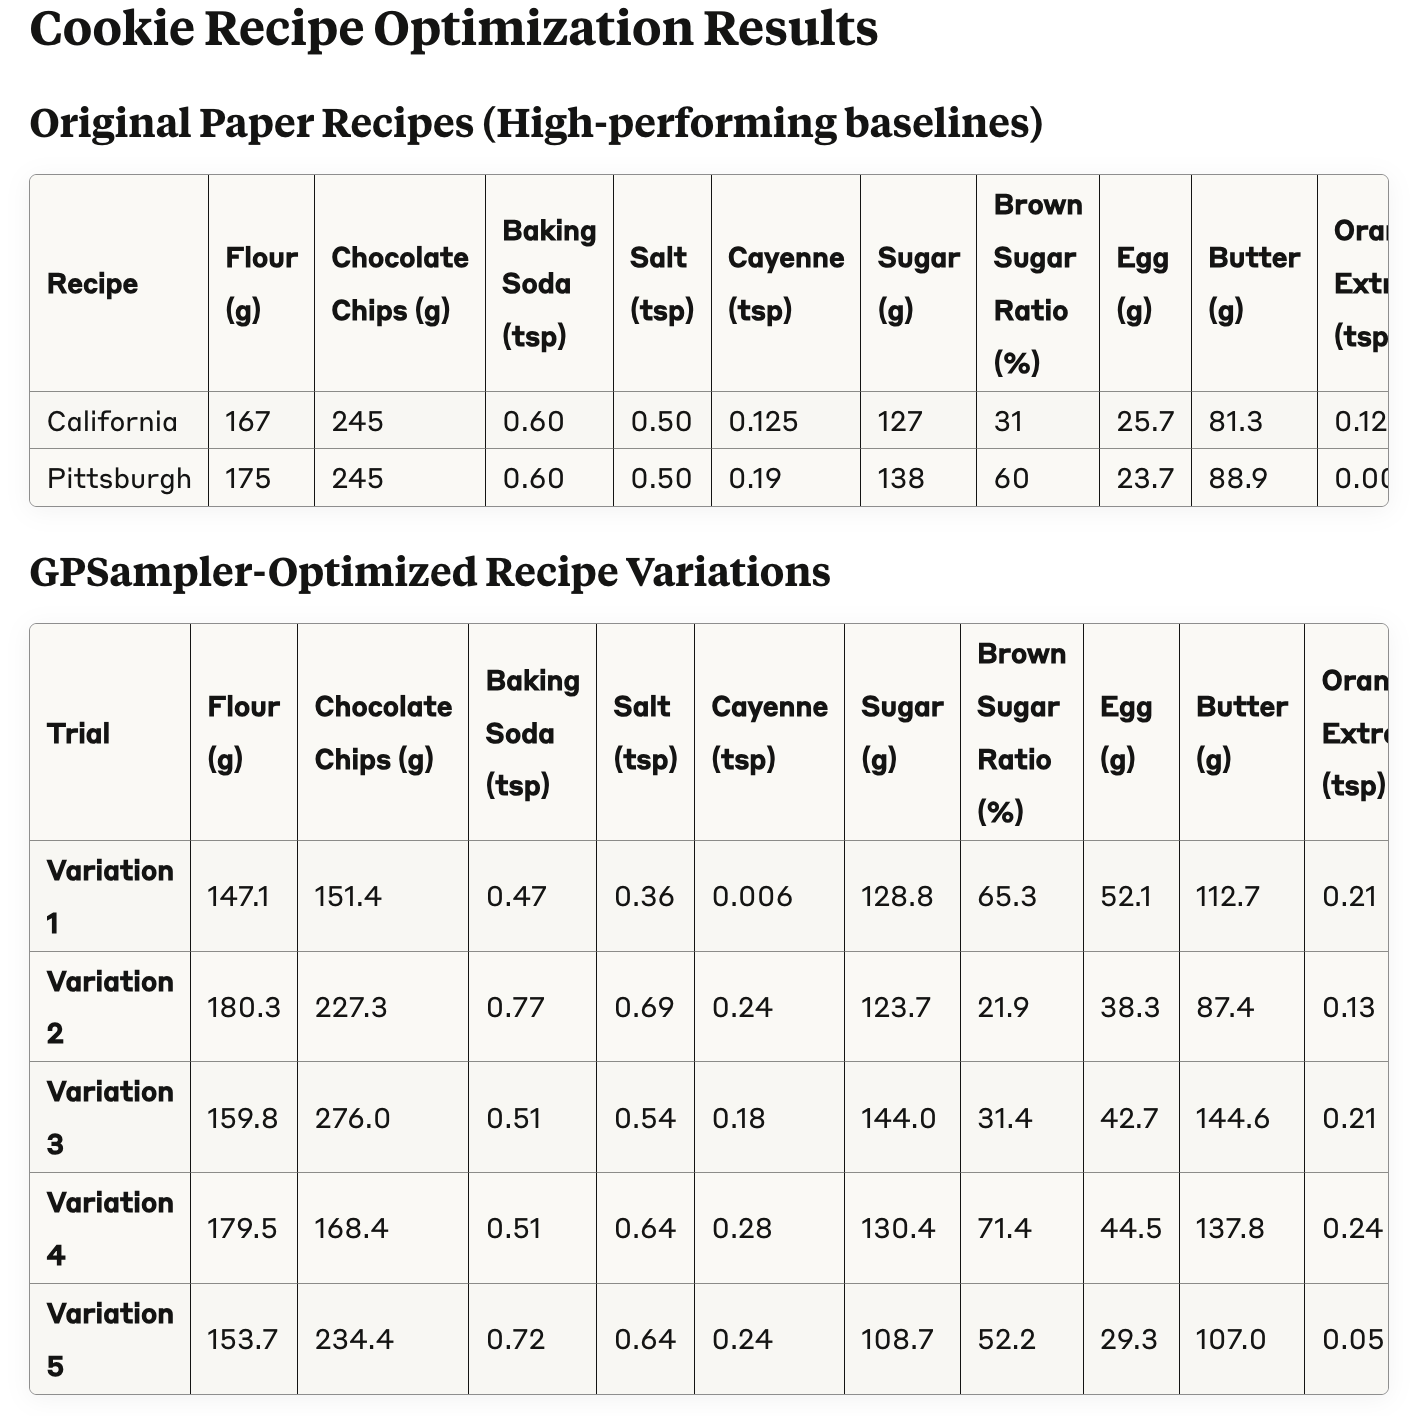
In this example, we will optimize a cookie recipe, referencing the paper titled "Bayesian Optimization for a Better Dessert".
Check out examples/cookie-recipe for details.
Optimizing the Matplotlib Configuration
This example optimizes a Matplotlib configuration.
Check out examples/auto-matplotlib for details.
License
MIT License (see LICENSE).