Click on "Install Server".
Wait a few minutes for the server to deploy. Once ready, it will show a "Started" state.
In the chat, type
@followed by the MCP server name and your instructions, e.g., "@Reaper MCP Serverparse my latest project and list all audio tracks"
That's it! The server will respond to your query, and you can continue using it as needed.
Here is a step-by-step guide with screenshots.
Reaper MCP Server
This is an MCP server that connects Reaper projects to an MCP client like Claude Desktop, enabling you to ask questions about your projects and get comprehensive audio analysis for mixing feedback.
Tools
Project Discovery & Parsing
find_reaper_projects: Finds all Reaper projects in the directory you specified in the config.parse_reaper_project: Parses a Reaper project file (.RPP) and returns detailed information including tempo, tracks, FX chains, and audio items.
These tools work in tandem. When you ask Claude a question about a specific Reaper project, it will use the find_reaper_projects tool to find the project, then use the parse_reaper_project tool to parse the project and answer your question.
Installed FX Discovery
list_installed_fx(plugin_type=None, search_query=None): Lists all installed FX/plugins available in Reaper.Parameters:
plugin_type(optional): Filter by plugin type (VST2, VST3, AU, JS, CLAP)search_query(optional): Search plugins by name, manufacturer, or type
Returns: List of installed plugins including:
Plugin name
Plugin type (VST2, VST3, AU, JS, CLAP)
File path
Manufacturer (when available)
Example Questions:
"What synth plugins do I have installed?"
"Show me all my Waves plugins"
"I'm looking for a warbly synth. What options do I have from my already installed plugins?"
"List all my VST3 plugins"
"Do I have any reverb plugins?"
"What iZotope plugins do I have?"
"Show me all my Audio Unit plugins"
Note: This tool scans your Reaper plugin cache files. If you recently installed new plugins and haven't scanned them in Reaper yet, they won't appear in the results. Make sure to open Reaper and let it scan for new plugins first.
Audio Analysis
analyze_audio_files(project_path, track_filter=None): Analyzes all audio files in a Reaper project for mixing feedback.Parameters:
project_path(required): Path to the .RPP project filetrack_filter(optional): Filter tracks by name (e.g., "Vocal" to analyze only vocal tracks)
Returns: Comprehensive audio analysis including:
Level Analysis: Peak levels, RMS, clipping detection
Frequency Analysis: Spectral content, energy distribution across frequency bands
Stereo Imaging: Stereo width, phase coherence, mono compatibility
Dynamic Range & Loudness: LUFS (loudness standards), true peak, crest factor
Example Questions:
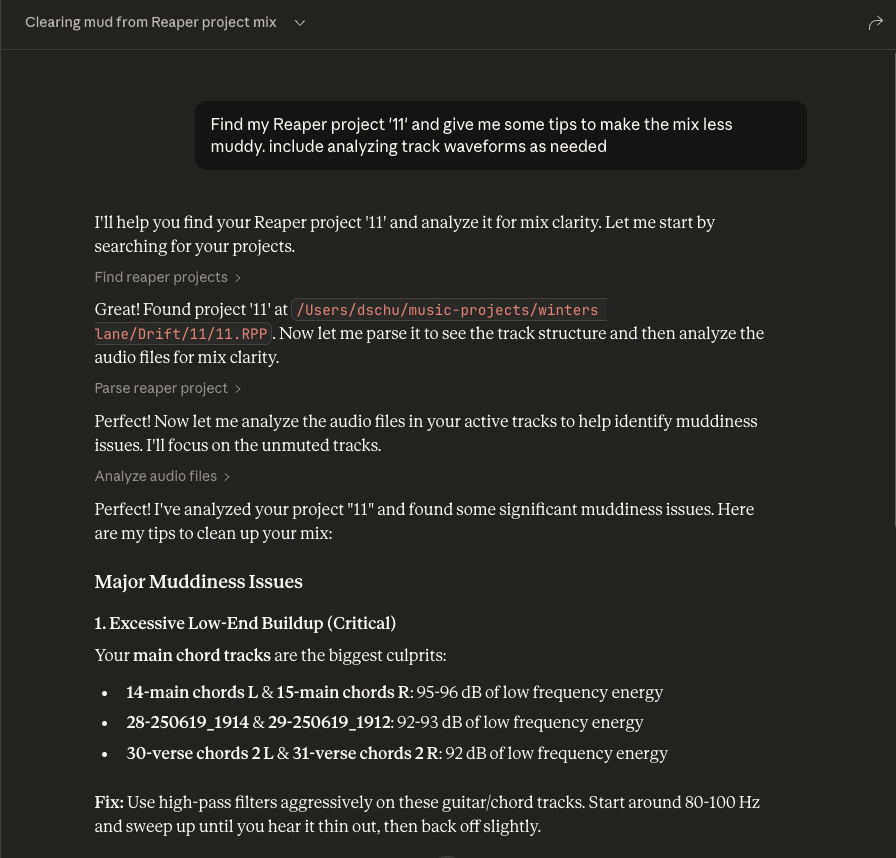
"Analyze all audio in my Rock Song project"
"Check the vocal tracks for clipping"
"Is my mix too loud for streaming platforms?"
"Are there any phase issues in my drum tracks?"
Warning Thresholds:
Peak > -0.3 dBFS: Risk of clipping
Clipping detected: Digital distortion present
Excessive low frequency energy (> -6 dB): Muddy mix
Phase coherence < 0.5: Phase cancellation issues
LUFS > -8: Too loud for streaming (Spotify target: -14 LUFS)
Crest factor < 6 dB: Possibly over-compressed
To see all data structures parsed from projects, check out the src/reaper_mcp_server/reaper_dataclasses.py file.
Related MCP server: Minesweeper MCP Server
Setup
Install Dependencies
uv venv
source .venv/bin/activate

uv pip install .
Configure Claude Desktop
Follow the instructions to configure Claude Desktop for use with a custom MCP server
Find the sample config in
setup/claude_desktop_config.jsonUpdate the following paths in the config:
Your
uvinstallation pathYour Reaper project directory
This server's directory
Launch and Configure
Open Claude Desktop
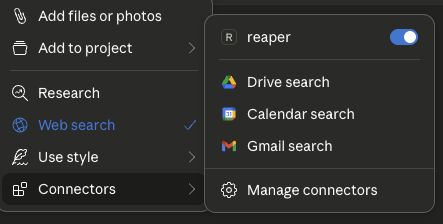
Click the '+' icon on the chat box
Click on 'Connectors' and you should see the 'reaper' connector enabled
Ask Away!
Ask questions about your Reaper project
Always include the name of the specific Reaper project you're asking about
You can expand the tool boxes to see the raw project data being passed to Claude