K8s Doctor MCP
Provides AI-powered diagnostic tools for Kubernetes clusters, including pod health analysis, CrashLoopBackOff debugging, log pattern detection, resource usage monitoring, and cluster-wide health checks with actionable recommendations.
Click on "Install Server".
Wait a few minutes for the server to deploy. Once ready, it will show a "Started" state.
In the chat, type
@followed by the MCP server name and your instructions, e.g., "@K8s Doctor MCPdiagnose my pod 'web-app' that keeps crashing"
That's it! The server will respond to your query, and you can continue using it as needed.
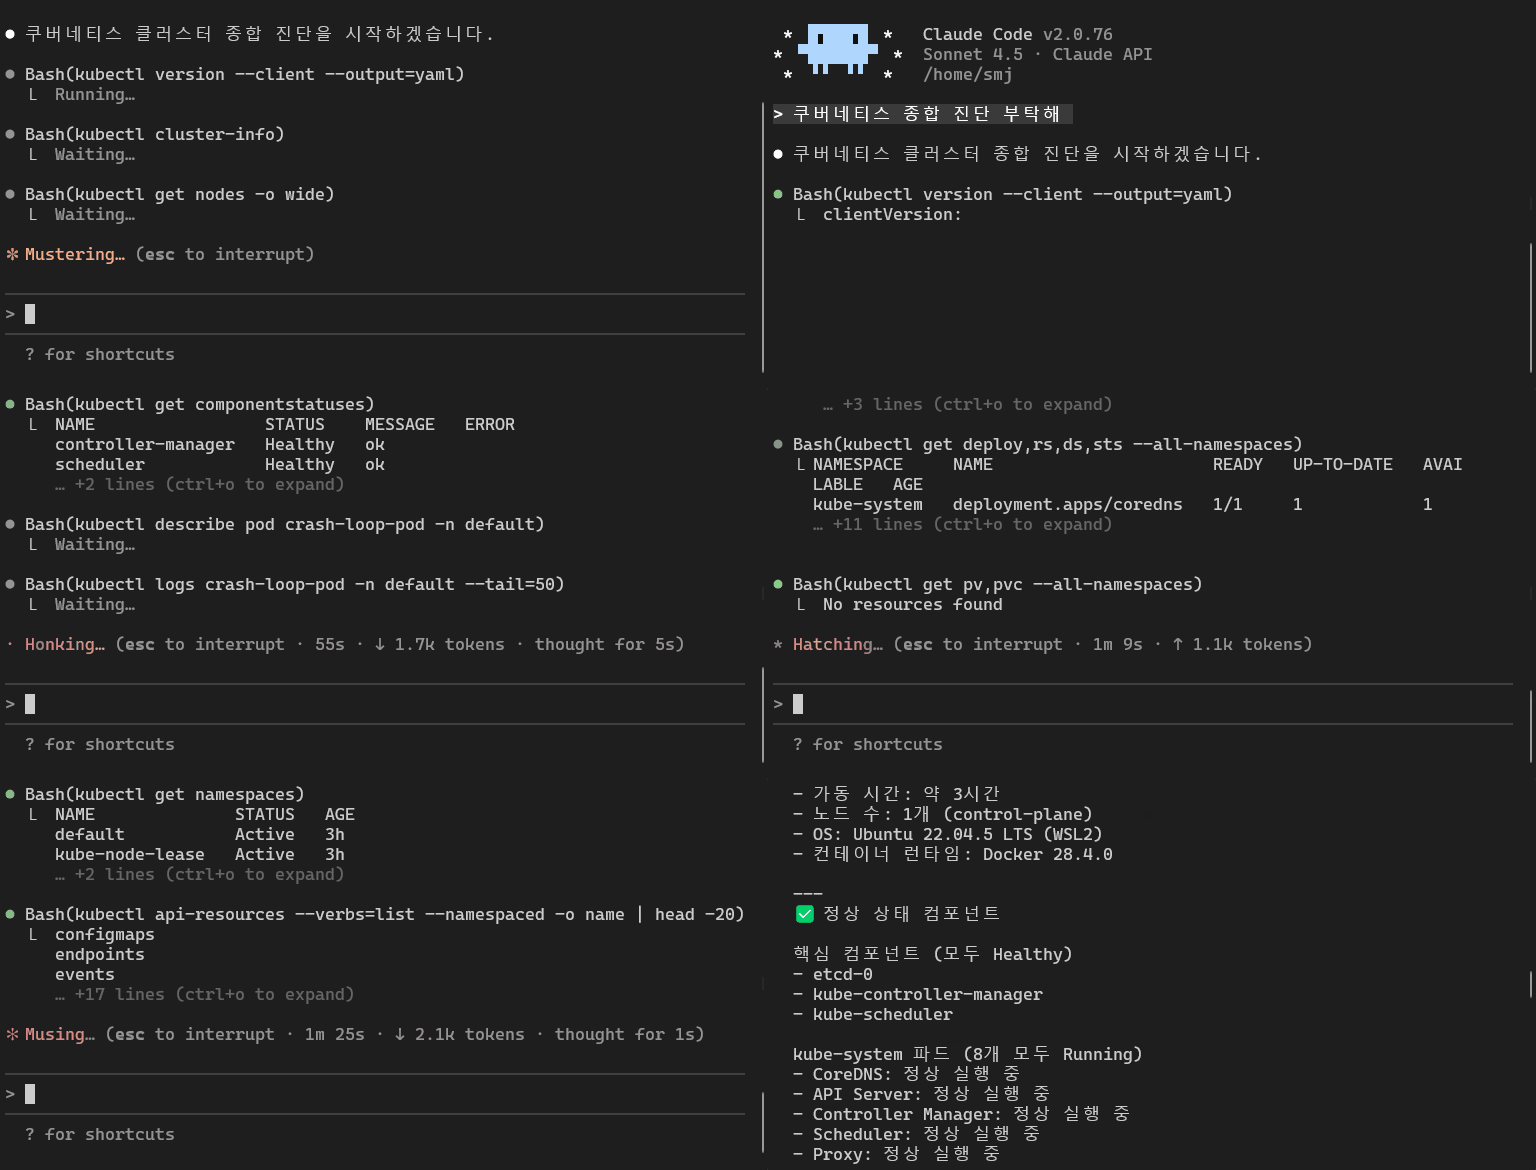
Here is a step-by-step guide with screenshots.
π₯ K8s Doctor MCP
AI-powered Kubernetes cluster diagnostics and intelligent debugging recommendations
Demo

Related MCP server: Kubernetes MCP Server
Why K8s Doctor?
When a Kubernetes issue strikes, developers typically run through an endless loop of:
kubectl get podskubectl logskubectl describeFrantically searching StackOverflow...
K8s Doctor changes the game. It's not just a kubectl wrapper - it's an AI-powered diagnostic tool that:
π Analyzes root causes - Goes beyond simple status checks
π§ Detects error patterns - Recognizes common issues (Connection Refused, OOM, DNS failures)
π‘ Provides actionable solutions - Gives you exact kubectl commands to fix problems
π Exit code analysis - Explains what exit 137, 143, 1 actually mean
π― Log pattern matching - Finds the signal in thousands of log lines
π₯ Health scoring - Rates your pod/cluster health 0-100
Features
Tool | Description |
| Comprehensive pod diagnostics - analyzes status, events, resources, and provides health score |
| CrashLoopBackOff specialist - decodes exit codes, analyzes logs, finds root cause |
| Smart log analysis - detects error patterns, suggests fixes for common issues |
| Resource usage - validates CPU/Memory limits, warns about OOM risks |
| Cluster health check - scans all nodes and pods for issues |
| Event analysis - filters and analyzes Warning events |
| Namespace listing - quick overview of all namespaces |
| Pod listing - shows problematic pods with status indicators |
Installation
Via npm (recommended)
npm install -g @zerry_jin/k8s-doctor-mcpFrom source
git clone https://github.com/ongjin/k8s-doctor-mcp.git
cd k8s-doctor-mcp
npm install && npm run buildSetup with Claude Code
# After npm global install
claude mcp add --scope project k8s-doctor -- k8s-doctor-mcp
# Or from source build
claude mcp add --scope project k8s-doctor -- node /path/to/k8s-doctor-mcp/dist/index.jsQuick Setup (Auto-approve Tools)
Tired of manually approving tool execution every time? Follow these steps to enable auto-approval.
π₯οΈ For Claude Desktop App Users
Restart the Claude Desktop App.
Ask your first question using
k8s-doctor.When the permission dialog appears, check the box "Always allow requests from this server" and click Allow. (Future requests will execute automatically without prompts.)
β¨οΈ For Claude Code (CLI) Users
If you are using the claude terminal command, manage permissions via the interactive menu:
Run
claudein your terminal.Type
/permissionsin the prompt and press Enter.Select Global Permissions (or Project Permissions) > Allowed Tools.
Enter
mcp__k8s-doctor__*to allow all tools, or add specific tools individually.
π‘ Tip: For most use cases, allowing
diagnose-pod,debug-crashloop, andanalyze-logsis sufficient. These three cover 90% of debugging scenarios.
Recommended configuration:
# Balanced approach - allow main diagnostic tools
claude config add allowedTools \
"mcp__k8s-doctor__diagnose-pod" \
"mcp__k8s-doctor__debug-crashloop" \
"mcp__k8s-doctor__analyze-logs" \
"mcp__k8s-doctor__full-diagnosis"Prerequisites
kubectl configured and working (
kubectl cluster-infoshould succeed)kubeconfig file in default location (
~/.kube/config) orKUBECONFIGenv var setNode.js 18 or higher
Access to a Kubernetes cluster (local like minikube/kind, or remote)
Usage Examples
Example 1: Diagnose a CrashLooping Pod
You: "My pod 'api-server' in namespace 'production' is CrashLooping. What's wrong?"
Claude (using k8s-doctor):
π CrashLoopBackOff μ§λ¨
Exit Code: 137 (OOM Killed)
Root Cause: Container was killed due to Out Of Memory
Solution:
Increase memory limit:
```yaml
resources:
limits:
memory: "512Mi" # Increase from current valueRelevant logs:
Line 1234: Error: JavaScript heap out of memory
Line 1256: FATAL ERROR: Reached heap limit
### Example 2: Analyze Application Logs
You: "Analyze logs for pod 'backend-worker' and tell me what's failing"
Claude (using analyze-logs): π Log Analysis
Detected Error Patterns:
π΄ Database Connection Error (15 occurrences) Possible Causes:
DB service not ready
Wrong connection string
Authentication failed
Solutions:
Check DB pod status
Verify environment variables (ConfigMap/Secret)
Check service endpoints: kubectl get endpoints
π‘ Timeout (8 occurrences) Likely cause: Response time too slow or network delay Solution: Increase timeout values or optimize service performance
### Example 3: Cluster Health Check
You: "Check overall cluster health"
Claude (using full-diagnosis): π₯ Cluster Health Diagnosis
Overall Score: 72/100 π
Nodes: 3/3 Ready β Pods: 45/52 Running
CrashLoop: 2 π₯
Pending: 5 β³
Critical Issues: π΄ Pod "payment-service" CrashLooping (exit 1) π΄ Pod "worker-3" OOM Killed
Recommendations:
Fix 2 CrashLoop pods immediately
Check if pending pods lack resources
## How It Works
1. **Connects to your cluster** via kubeconfig (same as kubectl)
2. **Gathers comprehensive data** - pod status, events, logs, resource usage
3. **Applies pattern matching** - recognizes common error patterns from production experience
4. **Analyzes root causes** - doesn't just show status, explains WHY it's failing
5. **Provides solutions** - gives exact commands and YAML to fix issues
## Error Patterns Detected
K8s Doctor recognizes these common patterns:
- π΄ **Connection Refused** - Service not ready, wrong port, network policy
- π΄ **Database Connection Errors** - DB auth, wrong connection strings
- π΄ **Out of Memory** - OOM kills, memory leaks, undersized limits
- π **File Not Found** - ConfigMap not mounted, wrong paths
- π **Permission Denied** - SecurityContext issues, fsGroup problems
- π **DNS Resolution Failed** - CoreDNS issues, wrong service names
- π‘ **Port Already in Use** - Multiple processes on same port
- π‘ **Timeout** - Slow responses, network delays
- π‘ **SSL/TLS Errors** - Expired certs, missing CA bundles
## Architecture
k8s-doctor-mcp/ βββ src/ β βββ index.ts # MCP server with all tools β βββ types.ts # TypeScript type definitions β βββ diagnostics/ β β βββ pod-diagnostics.ts # Pod health analysis β β βββ cluster-health.ts # Cluster-wide diagnostics β βββ analyzers/ β β βββ log-analyzer.ts # Smart log pattern matching β βββ utils/ β βββ k8s-client.ts # Kubernetes API client β βββ formatters.ts # Output formatting utilities βββ package.json
## Security Considerations
- K8s Doctor uses **read-only** Kubernetes API calls (list, get, describe)
- Requires same permissions as `kubectl get/describe/logs`
- Never modifies cluster state
- kubeconfig credentials stay local
- No data sent to external servers
## Troubleshooting
### "kubeconfig not found"
```bash
# Verify kubectl works
kubectl cluster-info
# Check kubeconfig location
echo $KUBECONFIG
# Test with explicit path
export KUBECONFIG=~/.kube/config"Permission denied"
# Check your cluster permissions
kubectl auth can-i get pods --all-namespaces
# You need at least read access to:
# - pods, events, namespaces, nodes"Connection refused to cluster"
# Verify cluster connectivity
kubectl get nodes
# For local clusters (minikube/kind)
minikube status
kind get clustersDevelopment
# Clone and install
git clone https://github.com/ongjin/k8s-doctor-mcp.git
cd k8s-doctor-mcp
npm install
# Development mode
npm run dev
# Build
npm run build
# Test with Claude Code
npm run build
claude mcp add --scope project k8s-doctor-dev -- node $(pwd)/dist/index.jsContributing
Contributions welcome! Especially:
π New error pattern detections
π Internationalization (more languages)
π Metrics integration (Prometheus, etc.)
π§ͺ Test coverage
π Documentation improvements
Roadmap
Metrics Server integration (real-time CPU/Memory usage)
Network policy diagnostics
Storage/PVC troubleshooting
Helm chart analysis
Multi-cluster support
Interactive debugging mode
Export reports (PDF, HTML)
License
MIT Β© zerry
Acknowledgments
Built with:
@modelcontextprotocol/sdk - Model Context Protocol
@kubernetes/client-node - Kubernetes JavaScript Client
Claude Code - AI-powered development
Star History
If this tool saves you debugging time, please β star the repo!
Author
zerry
GitHub: @zerry
Created for the DevOps community who are tired of kubectl hell π
Made with β€οΈ for Kubernetes users drowning in logs
Available Tools
8 toolsanalyze-logsSmart Log AnalysisC
Detects error patterns in logs and suggests causes and solutions (Connection Refused, OOM, DB errors, etc.)
| Name | Required | Description | Default |
|---|---|---|---|
| namespace | Yes | Namespace | |
| podName | Yes | Pod name | |
| containerName | No | Container name (optional) | |
| tailLines | No | Number of recent lines to analyze |
TDQS
Does the description disclose side effects, auth requirements, rate limits, or destructive behavior?
No annotations are provided, so the description carries full burden for behavioral disclosure. While it mentions the tool 'detects error patterns' and 'suggests causes and solutions', it doesn't describe what the output looks like, whether it's read-only or has side effects, performance characteristics, or any limitations. For a diagnostic tool with no annotation coverage, this leaves significant behavioral gaps.
Agents need to know what a tool does to the world before calling it. Descriptions should go beyond structured annotations to explain consequences.
Is the description appropriately sized, front-loaded, and free of redundancy?
The description is extremely conciseβa single sentence that efficiently communicates the core functionality with relevant examples. It's front-loaded with the main purpose and wastes no words. Every part of the sentence earns its place by adding value.
Shorter descriptions cost fewer tokens and are easier for agents to parse. Every sentence should earn its place.
Given the tool's complexity, does the description cover enough for an agent to succeed on first attempt?
Given the tool's complexity (analyzing logs for errors with suggestions), lack of annotations, and no output schema, the description is insufficient. It doesn't cover what the output contains, how suggestions are formatted, error handling, or limitations. For a tool that presumably returns structured diagnostic information, this leaves the agent with inadequate context to use it effectively.
Complex tools with many parameters or behaviors need more documentation. Simple tools need less. This dimension scales expectations accordingly.
Does the description clarify parameter syntax, constraints, interactions, or defaults beyond what the schema provides?
The schema description coverage is 100%, so all parameters are documented in the schema. The description adds no additional parameter semantics beyond what's in the schemaβit doesn't explain how parameters like 'namespace' or 'podName' relate to the log analysis process. With high schema coverage, the baseline score of 3 is appropriate as the description doesn't compensate but also doesn't detract.
Input schemas describe structure but not intent. Descriptions should explain non-obvious parameter relationships and valid value ranges.
Does the description clearly state what the tool does and how it differs from similar tools?
The description clearly states the tool's purpose: 'Detects error patterns in logs and suggests causes and solutions' with specific examples like 'Connection Refused, OOM, DB errors'. This is a specific verb+resource combination that distinguishes it from siblings like 'check-events' or 'debug-crashloop', though it doesn't explicitly differentiate from 'diagnose-pod' which might have overlapping functionality.
Agents choose between tools based on descriptions. A clear purpose with a specific verb and resource helps agents select the right tool.
Does the description explain when to use this tool, when not to, or what alternatives exist?
The description provides no guidance on when to use this tool versus alternatives. It doesn't mention prerequisites, context for usage, or differentiate from sibling tools like 'diagnose-pod' or 'full-diagnosis' that might serve similar diagnostic purposes. The agent must infer usage from the tool name and parameters alone.
Agents often have multiple tools that could apply. Explicit usage guidance like "use X instead of Y when Z" prevents misuse.
check-eventsEvent Query and AnalysisC
Queries events for specific resources or namespaces and analyzes Warning events
| Name | Required | Description | Default |
|---|---|---|---|
| namespace | Yes | Namespace | |
| resourceName | No | Resource name (optional, entire namespace if empty) | |
| showNormal | No | Show Normal events too |
TDQS
Does the description disclose side effects, auth requirements, rate limits, or destructive behavior?
With no annotations provided, the description carries the full burden of behavioral disclosure. It states the tool queries and analyzes events, implying read-only behavior, but lacks details on permissions, rate limits, output format, or error handling. For a query tool with no annotation coverage, this is a significant gap in transparency.
Agents need to know what a tool does to the world before calling it. Descriptions should go beyond structured annotations to explain consequences.
Is the description appropriately sized, front-loaded, and free of redundancy?
The description is concise and front-loaded in a single sentence, efficiently stating the tool's purpose without unnecessary details. It earns its place by covering key actions and targets, though it could be slightly more structured to separate querying from analysis aspects.
Shorter descriptions cost fewer tokens and are easier for agents to parse. Every sentence should earn its place.
Given the tool's complexity, does the description cover enough for an agent to succeed on first attempt?
Given the tool's complexity (querying and analyzing events), lack of annotations, and no output schema, the description is incomplete. It doesn't explain what 'analyzes' entails, the return format, or how results are presented. For a tool with behavioral and output uncertainties, more context is needed to be fully helpful.
Complex tools with many parameters or behaviors need more documentation. Simple tools need less. This dimension scales expectations accordingly.
Does the description clarify parameter syntax, constraints, interactions, or defaults beyond what the schema provides?
The description mentions querying events for 'specific resources or namespaces,' which aligns with the 'namespace' and 'resourceName' parameters, and analyzing 'Warning events,' which relates to 'showNormal.' However, with 100% schema description coverage, the schema already documents all parameters well. The description adds some context (e.g., focus on Warning events) but doesn't provide significant extra meaning beyond the schema.
Input schemas describe structure but not intent. Descriptions should explain non-obvious parameter relationships and valid value ranges.
Does the description clearly state what the tool does and how it differs from similar tools?
The description clearly states the tool's purpose: 'Queries events for specific resources or namespaces and analyzes Warning events.' This specifies both the action (queries and analyzes) and the target (events), with a focus on Warning events. However, it doesn't explicitly differentiate from sibling tools like 'analyze-logs' or 'debug-crashloop', which might also involve event analysis.
Agents choose between tools based on descriptions. A clear purpose with a specific verb and resource helps agents select the right tool.
Does the description explain when to use this tool, when not to, or what alternatives exist?
The description provides minimal guidance on when to use this tool. It mentions querying events for resources or namespaces and analyzing Warning events, but doesn't specify scenarios, prerequisites, or alternatives among siblings. For example, no comparison to 'analyze-logs' or 'debug-crashloop' is given, leaving usage context vague.
Agents often have multiple tools that could apply. Explicit usage guidance like "use X instead of Y when Z" prevents misuse.
check-resourcesResource Usage CheckC
Compares pod CPU/Memory usage against limits to check for threshold violations
| Name | Required | Description | Default |
|---|---|---|---|
| namespace | Yes | Namespace | |
| podName | No | Specific pod (optional, entire namespace if empty) |
TDQS
Does the description disclose side effects, auth requirements, rate limits, or destructive behavior?
No annotations are provided, so the description carries the full burden of behavioral disclosure. It states the tool compares usage against limits and checks for violations, but doesn't describe key behaviors: whether it requires specific permissions (e.g., cluster admin), how it handles missing limits, what constitutes a 'threshold violation' (e.g., percentage-based), or the output format (e.g., list of violations). For a monitoring tool with no annotation coverage, this is a significant gap.
Agents need to know what a tool does to the world before calling it. Descriptions should go beyond structured annotations to explain consequences.
Is the description appropriately sized, front-loaded, and free of redundancy?
The description is a single, efficient sentence that front-loads the core purpose without unnecessary words. Every element ('compares pod CPU/Memory usage against limits to check for threshold violations') earns its place by specifying the action, resource, and goal, making it highly concise and well-structured.
Shorter descriptions cost fewer tokens and are easier for agents to parse. Every sentence should earn its place.
Given the tool's complexity, does the description cover enough for an agent to succeed on first attempt?
Given the tool's complexity (monitoring with potential permission needs), lack of annotations, and no output schema, the description is incomplete. It doesn't cover behavioral aspects like authentication requirements, rate limits, error handling, or what the output contains (e.g., violation details). For a tool that interacts with cluster resources, more context is needed to ensure safe and effective use.
Complex tools with many parameters or behaviors need more documentation. Simple tools need less. This dimension scales expectations accordingly.
Does the description clarify parameter syntax, constraints, interactions, or defaults beyond what the schema provides?
Schema description coverage is 100%, with clear descriptions for both parameters ('namespace' and 'podName'). The description adds no additional parameter semantics beyond what the schema providesβit doesn't explain how 'podName' interacts with the comparison logic or specify default behaviors when 'podName' is empty. Baseline 3 is appropriate since the schema does the heavy lifting.
Input schemas describe structure but not intent. Descriptions should explain non-obvious parameter relationships and valid value ranges.
Does the description clearly state what the tool does and how it differs from similar tools?
The description clearly states the tool's purpose: 'Compares pod CPU/Memory usage against limits to check for threshold violations.' It specifies the verb ('compares'), resource ('pod CPU/Memory usage'), and objective ('check for threshold violations'). However, it doesn't explicitly differentiate from sibling tools like 'diagnose-pod' or 'check-events', which might have overlapping monitoring functions.
Agents choose between tools based on descriptions. A clear purpose with a specific verb and resource helps agents select the right tool.
Does the description explain when to use this tool, when not to, or what alternatives exist?
The description provides no guidance on when to use this tool versus alternatives. It doesn't mention prerequisites, such as needing access to Kubernetes metrics, or compare it to siblings like 'diagnose-pod' (which might offer broader diagnostics) or 'check-events' (which might focus on event logs). Usage is implied by the purpose but lacks explicit context or exclusions.
Agents often have multiple tools that could apply. Explicit usage guidance like "use X instead of Y when Z" prevents misuse.
debug-crashloopCrashLoopBackOff DiagnosticsC
Analyzes pods in CrashLoop state by examining exit codes, logs, and events to find the root cause
| Name | Required | Description | Default |
|---|---|---|---|
| namespace | Yes | Namespace | |
| podName | Yes | Pod name | |
| containerName | No | Container name (optional) |
TDQS
Does the description disclose side effects, auth requirements, rate limits, or destructive behavior?
No annotations are provided, so the description carries the full burden of behavioral disclosure. It mentions what the tool examines (exit codes, logs, events) but doesn't describe the output format, whether it's read-only or destructive, permission requirements, rate limits, or error handling. For a diagnostic tool with zero annotation coverage, this leaves significant gaps in understanding its behavior.
Agents need to know what a tool does to the world before calling it. Descriptions should go beyond structured annotations to explain consequences.
Is the description appropriately sized, front-loaded, and free of redundancy?
The description is a single, efficient sentence that clearly states the tool's purpose without unnecessary words. It's front-loaded with the main action and resource, making it easy to understand quickly. Every part of the sentence contributes meaning.
Shorter descriptions cost fewer tokens and are easier for agents to parse. Every sentence should earn its place.
Given the tool's complexity, does the description cover enough for an agent to succeed on first attempt?
Given the complexity of a diagnostic tool with no annotations and no output schema, the description is incomplete. It doesn't explain what the tool returns (e.g., a report, status codes, recommendations), how to interpret results, or any behavioral aspects like safety or side effects. For a tool that analyzes crash states, more context is needed to use it effectively.
Complex tools with many parameters or behaviors need more documentation. Simple tools need less. This dimension scales expectations accordingly.
Does the description clarify parameter syntax, constraints, interactions, or defaults beyond what the schema provides?
Schema description coverage is 100%, so the schema already documents all three parameters (namespace, podName, containerName) with basic descriptions. The description doesn't add any parameter-specific semantics beyond what's in the schema, such as format examples or constraints. The baseline score of 3 is appropriate when the schema handles parameter documentation.
Input schemas describe structure but not intent. Descriptions should explain non-obvious parameter relationships and valid value ranges.
Does the description clearly state what the tool does and how it differs from similar tools?
The description clearly states the tool's purpose: 'Analyzes pods in CrashLoop state by examining exit codes, logs, and events to find the root cause.' It specifies the verb ('analyzes'), resource ('pods in CrashLoop state'), and scope of analysis. However, it doesn't explicitly distinguish this tool from sibling tools like 'diagnose-pod' or 'full-diagnosis', which might have overlapping functionality.
Agents choose between tools based on descriptions. A clear purpose with a specific verb and resource helps agents select the right tool.
Does the description explain when to use this tool, when not to, or what alternatives exist?
The description provides no guidance on when to use this tool versus alternatives. It doesn't mention sibling tools like 'diagnose-pod' or 'full-diagnosis', nor does it specify prerequisites or exclusions. The context is implied (pods in CrashLoop state), but there's no explicit usage guidance.
Agents often have multiple tools that could apply. Explicit usage guidance like "use X instead of Y when Z" prevents misuse.
diagnose-podComprehensive pod diagnosticsC
Analyzes pod status, logs, and events to identify root causes and suggest solutions
| Name | Required | Description | Default |
|---|---|---|---|
| namespace | Yes | Namespace | |
| podName | Yes | Pod name | |
| detailed | No | Enable detailed analysis (includes logs) |
TDQS
Does the description disclose side effects, auth requirements, rate limits, or destructive behavior?
With no annotations provided, the description carries the full burden of behavioral disclosure. It mentions analyzing logs and events to identify root causes and suggest solutions, but does not specify whether this is a read-only operation, requires permissions, has side effects, or details output format. For a diagnostic tool with potential complexity, this leaves significant gaps in understanding its behavior.
Agents need to know what a tool does to the world before calling it. Descriptions should go beyond structured annotations to explain consequences.
Is the description appropriately sized, front-loaded, and free of redundancy?
The description is a single, efficient sentence that front-loads the core purpose without unnecessary words. It could be slightly more structured by separating key actions, but it effectively communicates the tool's intent in a concise manner, earning a high score for brevity and clarity.
Shorter descriptions cost fewer tokens and are easier for agents to parse. Every sentence should earn its place.
Given the tool's complexity, does the description cover enough for an agent to succeed on first attempt?
Given the tool's complexity (diagnosing pods with multiple parameters), lack of annotations, and no output schema, the description is incomplete. It does not address behavioral traits, output format, or usage context, which are critical for an agent to invoke the tool correctly in a server with many sibling tools, leading to significant gaps in contextual understanding.
Complex tools with many parameters or behaviors need more documentation. Simple tools need less. This dimension scales expectations accordingly.
Does the description clarify parameter syntax, constraints, interactions, or defaults beyond what the schema provides?
Schema description coverage is 100%, meaning the input schema already documents all parameters (namespace, podName, detailed) with descriptions. The description adds no additional meaning beyond what the schema provides, such as explaining how 'detailed' affects the analysis or the scope of logs included, so it meets the baseline but does not enhance parameter understanding.
Input schemas describe structure but not intent. Descriptions should explain non-obvious parameter relationships and valid value ranges.
Does the description clearly state what the tool does and how it differs from similar tools?
The description clearly states the tool's purpose as analyzing pod status, logs, and events to identify root causes and suggest solutions, which is specific and actionable. However, it does not explicitly distinguish this tool from siblings like 'analyze-logs', 'check-events', or 'full-diagnosis', which likely have overlapping functionalities, so it falls short of a perfect score.
Agents choose between tools based on descriptions. A clear purpose with a specific verb and resource helps agents select the right tool.
Does the description explain when to use this tool, when not to, or what alternatives exist?
The description provides no guidance on when to use this tool versus alternatives such as 'analyze-logs' or 'debug-crashloop'. It lacks explicit context, exclusions, or prerequisites, leaving the agent to infer usage based on the purpose alone, which is insufficient for effective tool selection.
Agents often have multiple tools that could apply. Explicit usage guidance like "use X instead of Y when Z" prevents misuse.
full-diagnosisCluster-wide Health DiagnosisC
Comprehensively analyzes cluster nodes, pods, and resources to evaluate health
| Name | Required | Description | Default |
|---|---|---|---|
| namespace | No | Specific namespace only (optional, all if empty) |
TDQS
Does the description disclose side effects, auth requirements, rate limits, or destructive behavior?
With no annotations provided, the description carries the full burden of behavioral disclosure. It mentions 'comprehensively analyzes' and 'evaluates health', but fails to specify whether this is a read-only operation, if it requires specific permissions, what output format to expect, or any performance implications like timeouts or resource usage.
Agents need to know what a tool does to the world before calling it. Descriptions should go beyond structured annotations to explain consequences.
Is the description appropriately sized, front-loaded, and free of redundancy?
The description is a single, efficient sentence that directly states the tool's function without unnecessary words. It's front-loaded with the core purpose ('Comprehensively analyzes...'), making it easy to parse and understand quickly.
Shorter descriptions cost fewer tokens and are easier for agents to parse. Every sentence should earn its place.
Given the tool's complexity, does the description cover enough for an agent to succeed on first attempt?
Given the complexity implied by 'cluster-wide health diagnosis' and the lack of annotations or output schema, the description is insufficient. It doesn't explain what 'health' entails, how results are presented, or any limitations, leaving significant gaps for an agent to use this tool effectively in context.
Complex tools with many parameters or behaviors need more documentation. Simple tools need less. This dimension scales expectations accordingly.
Does the description clarify parameter syntax, constraints, interactions, or defaults beyond what the schema provides?
The input schema has 100% description coverage, clearly documenting the optional 'namespace' parameter. The description adds no additional parameter semantics beyond what's in the schema, so it meets the baseline of 3 for adequate but not additive value.
Input schemas describe structure but not intent. Descriptions should explain non-obvious parameter relationships and valid value ranges.
Does the description clearly state what the tool does and how it differs from similar tools?
The description clearly states the tool's purpose with specific verbs ('analyzes', 'evaluates') and resources ('cluster nodes, pods, and resources'), making it easy to understand what it does. However, it doesn't explicitly differentiate from sibling tools like 'check-resources' or 'diagnose-pod', which appear to have overlapping scopes.
Agents choose between tools based on descriptions. A clear purpose with a specific verb and resource helps agents select the right tool.
Does the description explain when to use this tool, when not to, or what alternatives exist?
The description provides no guidance on when to use this tool versus alternatives like 'check-resources' or 'diagnose-pod'. It implies a comprehensive analysis but doesn't specify use cases, prerequisites, or exclusions, leaving the agent to guess based on tool names alone.
Agents often have multiple tools that could apply. Explicit usage guidance like "use X instead of Y when Z" prevents misuse.
list-namespacesList NamespacesB
Lists all namespaces in the cluster
| Name | Required | Description | Default |
|---|---|---|---|
No parameters | |||
TDQS
Does the description disclose side effects, auth requirements, rate limits, or destructive behavior?
No annotations are provided, so the description carries full burden. It states a read operation ('Lists'), implying it's non-destructive, but doesn't disclose behavioral traits such as permissions needed, rate limits, output format, or pagination. This is a significant gap for a tool with zero annotation coverage.
Agents need to know what a tool does to the world before calling it. Descriptions should go beyond structured annotations to explain consequences.
Is the description appropriately sized, front-loaded, and free of redundancy?
The description is a single, efficient sentence with no wasted words. It's front-loaded with the core action and resource, making it easy to parse quickly.
Shorter descriptions cost fewer tokens and are easier for agents to parse. Every sentence should earn its place.
Given the tool's complexity, does the description cover enough for an agent to succeed on first attempt?
Given no annotations and no output schema, the description is incomplete. It lacks details on behavioral context (e.g., permissions, output format) and doesn't help the agent understand when to use it versus sibling tools. For a simple list tool, more guidance is needed despite the zero parameters.
Complex tools with many parameters or behaviors need more documentation. Simple tools need less. This dimension scales expectations accordingly.
Does the description clarify parameter syntax, constraints, interactions, or defaults beyond what the schema provides?
With 0 parameters and 100% schema description coverage, the schema already fully documents the input (none). The description adds no parameter information, but this is acceptable as there are no parameters to explain. Baseline is 4 for zero parameters.
Input schemas describe structure but not intent. Descriptions should explain non-obvious parameter relationships and valid value ranges.
Does the description clearly state what the tool does and how it differs from similar tools?
The description clearly states the verb ('Lists') and resource ('all namespaces in the cluster'), making the purpose immediately understandable. However, it doesn't differentiate from sibling tools like 'list-pods' beyond the resource type, missing explicit comparison.
Agents choose between tools based on descriptions. A clear purpose with a specific verb and resource helps agents select the right tool.
Does the description explain when to use this tool, when not to, or what alternatives exist?
The description provides no guidance on when to use this tool versus alternatives like 'list-pods' or other diagnostic tools. It lacks context about typical use cases or prerequisites, leaving the agent to infer usage from the tool name alone.
Agents often have multiple tools that could apply. Explicit usage guidance like "use X instead of Y when Z" prevents misuse.
list-podsList PodsC
Lists all pods in a specific namespace
| Name | Required | Description | Default |
|---|---|---|---|
| namespace | Yes | Namespace | |
| showAll | No | Show all pods (default shows only problematic pods) |
TDQS
Does the description disclose side effects, auth requirements, rate limits, or destructive behavior?
With no annotations provided, the description carries full burden for behavioral disclosure. While 'Lists' implies a read operation, it doesn't specify whether this requires specific permissions, how results are formatted, if there are rate limits, or what happens when no pods exist. The description adds minimal behavioral context beyond the basic action.
Agents need to know what a tool does to the world before calling it. Descriptions should go beyond structured annotations to explain consequences.
Is the description appropriately sized, front-loaded, and free of redundancy?
The description is a single, efficient sentence that communicates the core purpose without any wasted words. It's appropriately sized for a simple list operation and front-loads the essential information.
Shorter descriptions cost fewer tokens and are easier for agents to parse. Every sentence should earn its place.
Given the tool's complexity, does the description cover enough for an agent to succeed on first attempt?
For a tool with no annotations and no output schema, the description is insufficiently complete. It doesn't explain what information is returned about pods, how results are structured, or address potential edge cases. Given the context of Kubernetes pods where output format matters significantly, this leaves important gaps.
Complex tools with many parameters or behaviors need more documentation. Simple tools need less. This dimension scales expectations accordingly.
Does the description clarify parameter syntax, constraints, interactions, or defaults beyond what the schema provides?
Schema description coverage is 100%, so the schema already documents both parameters thoroughly. The description mentions 'specific namespace' which aligns with the required parameter but adds no additional semantic context beyond what's in the schema. This meets the baseline expectation when schema coverage is complete.
Input schemas describe structure but not intent. Descriptions should explain non-obvious parameter relationships and valid value ranges.
Does the description clearly state what the tool does and how it differs from similar tools?
The description clearly states the action ('Lists') and resource ('all pods in a specific namespace'), making the purpose immediately understandable. However, it doesn't differentiate from potential sibling tools like 'list-namespaces' or 'check-resources' beyond the specific resource type, which prevents a perfect score.
Agents choose between tools based on descriptions. A clear purpose with a specific verb and resource helps agents select the right tool.
Does the description explain when to use this tool, when not to, or what alternatives exist?
The description provides no guidance on when to use this tool versus alternatives. It doesn't mention when this tool is appropriate compared to sibling tools like 'diagnose-pod' or 'full-diagnosis', nor does it specify prerequisites or constraints beyond the required namespace parameter.
Agents often have multiple tools that could apply. Explicit usage guidance like "use X instead of Y when Z" prevents misuse.
Tool Schema Changelog
Recent tool additions, removals, and schema changes observed during successful MCP inspections.
8 tool updates
v1.0.0- First observed
analyze-logs - First observed
check-events - First observed
check-resources - First observed
debug-crashloop - First observed
diagnose-pod - First observed
full-diagnosis - First observed
list-namespaces - First observed
list-pods
TDQS
Scored across 8 tools
There is significant overlap between tools like diagnose-pod, debug-crashloop, and analyze-logs, which all involve analyzing pod issues with logs and events, potentially causing confusion. However, tools like list-namespaces and list-pods have distinct purposes, and the descriptions help clarify some boundaries, such as debug-crashloop focusing specifically on CrashLoop states.
Most tools follow a consistent verb_noun pattern (e.g., analyze-logs, check-events, list-pods), with clear and readable names. The only minor deviation is full-diagnosis, which uses a hyphenated adjective-noun form instead of a verb, but overall the naming is predictable and easy to understand.
With 8 tools, the count is well-scoped for a Kubernetes diagnostic server, covering a range of common troubleshooting tasks without being overwhelming. Each tool appears to serve a specific purpose in cluster analysis, making the set appropriately sized for its domain.
The tool set covers key diagnostic areas like logs, events, resources, and pod states, with comprehensive tools like full-diagnosis. A minor gap is the lack of tools for proactive monitoring or remediation actions (e.g., fixing issues), but agents can work around this by using the analysis tools to identify problems.
Maintenance
Resources
Unclaimed servers have limited discoverability.
Looking for Admin?
If you are the server author, to access and configure the admin panel.
Related MCP Connectors
- SuperlogOAuthsh.superlog
Open-source agent that observes and fixes your application. Query logs, traces, metrics, incidents.
Fail-closed policy guardrails for AI agents running kubectl, terraform, helm, and argocd.
- emisarOAuthdev.emisar
Let AI operate servers without SSH. Choose actions, approve risky changes, and audit every step.
AI agent observability for production traces, natural-language insights, and improvement loops.
Related MCP Servers
- FlicenseNot gradedqualityDmaintenanceEnables real-time Kubernetes cluster observability and debugging through standardized MCP interface. Provides access to pods, services, nodes, events, and includes built-in tools for cluster health analysis and issue identification.-
- FlicenseNot gradedqualityDmaintenanceEnables interactive Kubernetes cluster monitoring and troubleshooting through natural language queries. Users can diagnose pod issues, check service status, and investigate cluster problems using conversational AI.-
- AlicenseNot gradedqualityBmaintenanceEnables natural language Kubernetes operations, including smart resource queries, pod root-cause analysis, cross-environment diffs, and manifest generation.MIT
- FlicenseNot gradedqualityCmaintenanceAutonomous AI agent for Kubernetes triage and infrastructure management using natural language.-