
A
licenseB
qualityD
maintenanceA Model Context Protocol server that connects to Chrome debugging ports, enabling browser automation with persistent login sessions.
10
17 npm
10
MIT

Provides comprehensive Electron application automation, debugging, and observability capabilities through Chrome DevTools Protocol integration. Enables UI automation, screenshot capture, DOM inspection, real-time logs, and application control without requiring code modifications to target applications.
Provides integration with GitHub for repository access, licensing information, and contribution workflows.
Offers support integration through Ko-fi for project funding and maintenance contributions.
Enables installation and distribution through the npm package registry, with version tracking and package management.
Includes a demo video hosted on Vimeo that showcases the MCP server's capabilities for Electron application automation.
Click on "Deploy Server".
Wait a few minutes for the server to deploy. Once ready, it will show a "Started" state.
In the chat, type @ followed by the MCP server name and your instructions, e.g., "@Electron MCP Server take a screenshot of the main window and show me the DOM structure"
That's it! The server will respond to your query, and you can continue using it as needed.
Here is a step-by-step guide with screenshots.


Control any Electron app with natural language. An MCP server that lets AI assistants (Claude, Cursor, VS Code, …) drive your Electron app: click buttons, fill forms, take screenshots, read console logs, and run JavaScript inside it — all over the Chrome DevTools Protocol, with no changes to your app.
npx -y electron-mcp-serverThen ask your AI: "Click the Settings button in my Electron app and screenshot the result."
Why you might want it
🤖 AI-driven UI automation — describe the interaction ("click Submit", "fill the email field"); no selector wrangling
🐛 Debugging without DevTools — console logs and page structure pulled straight into the chat
📸 Screenshots on demand — returned as image data the AI can actually look at
⚡ Zero app changes — attaches over CDP to any Electron app started with --remote-debugging-port=9222
🔒 Security levels — strict → development, so you choose how much the AI may do
🧪 Automated E2E flows — turn manual test steps into repeatable AI-run scenarios
The 4 tools it exposes: get_electron_window_info, take_screenshot, send_command_to_electron (UI interaction + eval), read_electron_logs.
See the Electron MCP Server in action:
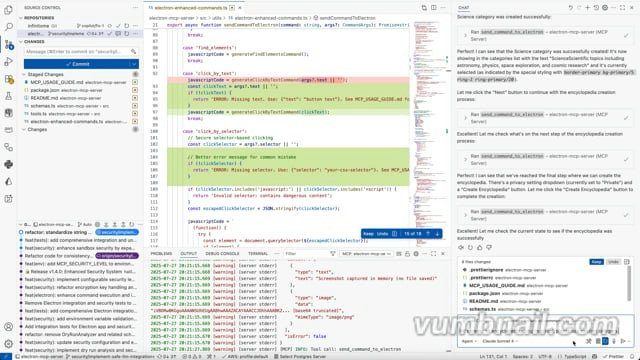
Watch how easy it is to automate Electron applications with AI-powered MCP commands.
Related MCP server: MCP Selenium Server
Configurable security levels to balance safety with functionality:
🔒 STRICT: Maximum security for production environments
⚖️ BALANCED: Default security with safe UI interactions (recommended)
🔓 PERMISSIVE: More functionality for trusted environments
🛠️ DEVELOPMENT: Minimal restrictions for development/testing
Configure the security level and other settings through your MCP client configuration:
VS Code MCP Settings:
{
  "mcp": {
    "servers": {
      "electron": {
        "command": "npx",
        "args": ["-y", "electron-mcp-server"],
        "env": {
          "SECURITY_LEVEL": "balanced",
          "SCREENSHOT_ENCRYPTION_KEY":"your-32-byte-hex-string"
        }
      }
    }
  }
}
Claude Desktop Configuration:
{
  "mcpServers": {
    "electron": {
      "command": "npx",
      "args": ["-y", "electron-mcp-server"],
      "env": {
        "SECURITY_LEVEL": "balanced",
        "SCREENSHOT_ENCRYPTION_KEY":"your-32-byte-hex-string"
      }
    }
  }
}
Alternative: Local .env file (for development):
# Create .env file in your project directory
SECURITY_LEVEL=balanced
SCREENSHOT_ENCRYPTION_KEY=your-32-byte-hex-string
Security Level Behaviors:
Level | UI Interactions | DOM Queries | Property Access | Assignments | Function Calls | Risk Threshold |
| ❌ Blocked | ❌ Blocked | ✅ Allowed | ❌ Blocked | ❌ None allowed | Low |
| ✅ Allowed | ✅ Allowed | ✅ Allowed | ❌ Blocked | ✅ Safe UI functions | Medium |
| ✅ Allowed | ✅ Allowed | ✅ Allowed | ✅ Allowed | ✅ Extended UI functions | High |
| ✅ Allowed | ✅ Allowed | ✅ Allowed | ✅ Allowed | ✅ All functions | Critical |
Environment Setup:
Copy .env.example to .env
Set SECURITY_LEVEL to your desired level
Configure other security settings as needed
cp .env.example .env
# Edit .env and set SECURITY_LEVEL=balancedInstead of raw JavaScript eval, use these secure commands:
// ✅ Secure button clicking
{
  "command": "click_by_text",
  "args": { "text": "Create New Encyclopedia" }
}

// ✅ Secure element selection
{
  "command": "click_by_selector",
  "args": { "selector": "button[title='Create']" }
}

// ✅ Secure keyboard shortcuts
{
  "command": "send_keyboard_shortcut",
  "args": { "text": "Ctrl+N" }
}

// ✅ Secure navigation
{
  "command": "navigate_to_hash",
  "args": { "text": "create" }
}
See SECURITY_CONFIG.md for detailed security documentation.
The most common mistake when using this MCP server is incorrect argument structure for the send_command_to_electron tool.
{
  "command": "click_by_selector",
  "args": "button.submit-btn"  // ❌ Raw string - WRONG!
}{
"command": "click_by_selector",
"args": {
"selector": "button.submit-btn" // ✅ Object with selector property
}
}Command | Required Args | Example |
|
|
|
|
|
|
|
|
|
|
|
|
|
|
|
| No args needed |
|
Inspect: Start with get_page_structure or debug_elements
Target: Use specific selectors or text-based targeting
Interact: Use the appropriate command with correct argument structure
Verify: Take screenshots or check page state
// Step 1: Understand the page
{
  "command": "get_page_structure"
}

// Step 2: Click button using text (most reliable)
{
  "command": "click_by_text",
  "args": {
    "text": "Create New Encyclopedia"
  }
}

// Step 3: Fill form field
{
  "command": "fill_input",
  "args": {
    "placeholder": "Enter encyclopedia name",
    "value": "AI and Machine Learning"
  }
}

// Step 4: Submit with selector
{
  "command": "click_by_selector",
  "args": {
    "selector": "button[type='submit']"
  }
}Error | Cause | Solution |
"The provided selector is empty" | Passing string instead of object | Use |
"Element not found" | Wrong selector | Use |
"Command blocked" | Security restriction | Check security level settings |
"Click prevented - too soon" | Rapid consecutive clicks | Wait before retrying |
Enterprise-grade security built for safe AI-powered automation:
🔒 Sandboxed Execution: All code runs in isolated environments with strict resource limits
🔍 Input Validation: Advanced static analysis detects and blocks dangerous code patterns
📝 Comprehensive Auditing: Encrypted logs track all operations with full traceability
🖼️ Secure Screenshots: Encrypted screenshot data with clear user notifications
⚠️ Risk Assessment: Automatic threat detection with configurable security thresholds
🚫 Zero Trust: Dangerous functions like eval, file system access, and network requests are blocked by default
Safety First: Every command is analyzed, validated, and executed in a secure sandbox before reaching your application.
Launch & Manage: Start, stop, and monitor Electron applications with full lifecycle control
Interactive Automation: Execute JavaScript code directly in running applications via WebSocket
UI Testing: Automate button clicks, form interactions, and user workflows
Process Management: Track PIDs, monitor resource usage, and handle graceful shutdowns
Screenshot Capture: Non-intrusive visual snapshots using Playwright and Chrome DevTools Protocol
Real-time Logs: Stream application logs (main process, renderer, console) with filtering
Window Information: Get detailed window metadata, titles, URLs, and target information
System Monitoring: Track memory usage, uptime, and performance metrics
Universal Compatibility: Works with any Electron app without requiring code modifications
DevTools Integration: Leverage Chrome DevTools Protocol for powerful debugging capabilities
Build Automation: Cross-platform building for Windows, macOS, and Linux
Environment Management: Clean environment handling and debugging port configuration
Add to your VS Code MCP settings:
{
  "mcp": {
    "servers": {
      "electron": {
        "command": "npx",
        "args": ["-y", "electron-mcp-server"],
        "env": {
          "SECURITY_LEVEL": "balanced",
          "SCREENSHOT_ENCRYPTION_KEY": "your-32-byte-hex-string-here"
        }
      }
    }
  }
}Add to ~/Library/Application Support/Claude/claude_desktop_config.json:
{
  "mcpServers": {
    "electron": {
      "command": "npx",
      "args": ["-y", "electron-mcp-server"],
      "env": {
        "SECURITY_LEVEL": "balanced",
        "SCREENSHOT_ENCRYPTION_KEY": "your-32-byte-hex-string-here"
      }
    }
  }
}npm install -g electron-mcp-serverlaunch_electron_appLaunch an Electron application with debugging capabilities.
{
  "appPath": "/path/to/electron-app",
  "devMode": true,  // Enables Chrome DevTools Protocol on port 9222
  "args": ["--enable-logging", "--dev"]
}Returns: Process ID and launch confirmation
get_electron_window_infoGet comprehensive window and target information via Chrome DevTools Protocol.
{
  "includeChildren": true  // Include child windows and DevTools instances
}Returns:
Window IDs, titles, URLs, and types
DevTools Protocol target information
Platform details and process information
take_screenshotCapture high-quality screenshots using Playwright and Chrome DevTools Protocol.
{
  "outputPath": "/path/to/screenshot.png",  // Optional: defaults to temp directory
  "windowTitle": "My App"  // Optional: target specific window
}Features:
Non-intrusive capture (doesn't bring window to front)
Works with any Electron app
Fallback to platform-specific tools if needed
send_command_to_electronExecute JavaScript commands in the running Electron application via WebSocket.
{
  "command": "eval",  // Built-in commands: eval, get_title, get_url, click_button, console_log
  "args": {
    "code": "document.querySelector('button').click(); 'Button clicked!'"
  }
}
Enhanced UI Interaction Commands:
find_elements: Analyze all interactive UI elements with their properties and positions
click_by_text: Click elements by their visible text, aria-label, or title (more reliable than selectors)
fill_input: Fill input fields by selector, placeholder text, or associated label text
select_option: Select dropdown options by value or visible text
get_page_structure: Get organized overview of all page elements (buttons, inputs, selects, links)
get_title: Get document title
get_url: Get current URL
get_body_text: Extract visible text content
click_button: Click buttons by CSS selector (basic method)
console_log: Send console messages
eval: Execute custom JavaScript code
Recommended workflow: Use get_page_structure first to understand available elements, then use specific interaction commands like click_by_text or fill_input.
read_electron_logsStream application logs from main process, renderer, and console.
{
  "logType": "all",  // Options: "all", "main", "renderer", "console"
  "lines": 50,       // Number of recent lines
  "follow": false    // Stream live logs
}close_electron_appGracefully close the Electron application.
{
  "force": false  // Force kill if unresponsive
}build_electron_appBuild Electron applications for distribution.
{
  "projectPath": "/path/to/project",
  "platform": "darwin",  // win32, darwin, linux
  "arch": "x64",         // x64, arm64, ia32
  "debug": false
}// 1. First, understand the page structure
await send_command_to_electron({
command: 'get_page_structure',
});
// 2. Click a button by its text (much more reliable than selectors)
await send_command_to_electron({
command: 'click_by_text',
args: {
text: 'Login', // Finds buttons containing "Login" in text, aria-label, or title
},
});
// 3. Fill inputs by their label or placeholder text
await send_command_to_electron({
command: 'fill_input',
args: {
text: 'username', // Finds input with label "Username" or placeholder "Enter username"
value: 'john.doe@example.com',
},
});
await send_command_to_electron({
command: 'fill_input',
args: {
text: 'password',
value: 'secretpassword',
},
});
// 4. Select dropdown options by visible text
await send_command_to_electron({
command: 'select_option',
args: {
text: 'country', // Finds select with label containing "country"
value: 'United States', // Selects option with this text
},
});
// 5. Take a screenshot to verify the result
await take_screenshot();// Find all interactive elements with detailed information
await send_command_to_electron({
command: 'find_elements',
});
// This returns detailed info about every clickable element and input:
// {
// "type": "clickable",
// "text": "Submit Form",
// "id": "submit-btn",
// "className": "btn btn-primary",
// "ariaLabel": "Submit the registration form",
// "position": { "x": 100, "y": 200, "width": 120, "height": 40 },
// "visible": true
// }// Launch app in development mode
await launch_electron_app({
appPath: '/path/to/app',
devMode: true,
});
// Take a screenshot
await take_screenshot();
// Click a button programmatically
await send_command_to_electron({
command: 'eval',
args: {
code: "document.querySelector('#submit-btn').click()",
},
});
// Verify the result
await send_command_to_electron({
command: 'get_title',
});// Get window information
const windowInfo = await get_electron_window_info();
// Extract application data
await send_command_to_electron({
command: 'eval',
args: {
code: 'JSON.stringify(window.appState, null, 2)',
},
});
// Monitor logs
await read_electron_logs({
logType: 'all',
lines: 100,
});// Get system information
await send_command_to_electron({
command: 'eval',
args: {
code: '({memory: performance.memory, timing: performance.timing})',
},
});
// Take periodic screenshots for visual regression testing
await take_screenshot({
outputPath: '/tests/screenshots/current.png',
});Universal Compatibility: Works with any Electron app that has remote debugging enabled
Real-time Communication: WebSocket-based command execution with the renderer process
No App Modifications: Zero changes required to target applications
Clean Environment: Handles ELECTRON_RUN_AS_NODE and other environment variables
Resource Tracking: Monitors PIDs, memory usage, and application lifecycle
Graceful Shutdown: Proper cleanup and process termination
macOS: Uses Playwright CDP with screencapture fallback
Windows: PowerShell-based window detection and capture
Linux: X11 window management (planned)
Node.js 20+
TypeScript 4.5+
Electron - Required for running and testing Electron applications
# Install Electron globally (recommended)
npm install -g electron

# Or install locally in your project
npm install electron --save-devFor the MCP server to work with your Electron application, you need to enable remote debugging. Add this code to your Electron app's main process:
const { app } = require('electron');
const isDev = process.env.NODE_ENV === 'development' || process.argv.includes('--dev');

// Enable remote debugging in development mode
if (isDev) {
  app.commandLine.appendSwitch('remote-debugging-port', '9222');
}
Alternative approaches:
# Launch your app with debugging enabled
electron . --remote-debugging-port=9222

# Or via npm script
npm run dev -- --remote-debugging-port=9222
Note: The MCP server automatically scans ports 9222-9225 to detect running Electron applications with remote debugging enabled.
git clone https://github.com/halilural/electron-mcp-server.git
cd electron-mcp-server

npm install
npm run build

# Run tests
npm test

# Development mode with auto-rebuild
npm run devThe project includes comprehensive test files for React compatibility:
# Run React compatibility tests
cd tests/integration/react-compatibility
electron test-react-electron.js
See tests/integration/react-compatibility/README.md for detailed testing instructions and scenarios.
This MCP server has been thoroughly tested with React applications and handles common React patterns correctly:
✅ React Event Handling: Properly handles preventDefault() in click handlers
✅ Form Input Detection: Advanced scoring algorithm works with React-rendered inputs
✅ Component Interaction: Compatible with React components, hooks, and state management
src/
├── handlers.ts      # MCP tool handlers
├── index.ts         # Server entry point
├── tools.ts         # Tool definitions
├── screenshot.ts    # Screenshot functionality
├── utils/
│   ├── process.ts   # Process management & DevTools Protocol
│   ├── logs.ts      # Log management
│   └── project.ts   # Project scaffolding
└── schemas/ # JSON schemas for validationSandboxed Execution: All JavaScript execution is contained within the target Electron app
Path Validation: Only operates on explicitly provided application paths
Process Isolation: Each launched app runs in its own process space
No Persistent Access: No permanent modifications to target applications
We welcome contributions! Please see our Contributing Guide for details.
Before reporting issues: Please use the standardized ISSUE_TEMPLATE.md for proper bug reporting format. For React compatibility problems or similar technical issues, also review REACT_COMPATIBILITY_ISSUES.md for detailed debugging examples, including proper command examples, error outputs, and reproduction steps.
Fork the repository
Create a feature branch (git checkout -b feature/awesome-feature)
Commit your changes (git commit -m 'Add awesome feature')
Push to the branch (git push origin feature/awesome-feature)
Open a Pull Request
MIT License - see LICENSE file for details.
If this project helped you, consider buying me a coffee! ☕

Your support helps me maintain and improve this project. Thank you! 🙏
Model Context Protocol - Standardized AI-application interface
Chrome DevTools Protocol - Universal debugging interface
Playwright - Reliable browser automation
Electron - Cross-platform desktop applications
Issue Template - Standardized bug reporting format
React Compatibility Issues Documentation - Technical debugging guide for React applications
Ready to supercharge your Electron development with AI-powered automation? Install the MCP server and start building smarter workflows today! 🚀
Get information about running Electron applications and their windows. Automatically detects any Electron app with remote debugging enabled (port 9222).
| Name | Required | Description | Default |
|---|---|---|---|
| includeChildren | No | Include child windows information |
Does the description disclose side effects, auth requirements, rate limits, or destructive behavior?
No annotations are provided, so the description carries the full burden. It discloses that the tool automatically detects apps with remote debugging on port 9222, which is useful behavioral context. However, it lacks details on permissions needed, rate limits, error handling, or what specific information is returned (e.g., window titles, IDs, states). For a tool with no annotations, this leaves significant gaps in understanding its behavior.
Agents need to know what a tool does to the world before calling it. Descriptions should go beyond structured annotations to explain consequences.
Is the description appropriately sized, front-loaded, and free of redundancy?
The description is appropriately sized and front-loaded: the first sentence states the core purpose, and the second adds crucial context about automatic detection. Both sentences earn their place by providing essential information without redundancy or fluff, making it efficient and well-structured.
Shorter descriptions cost fewer tokens and are easier for agents to parse. Every sentence should earn its place.
Given the tool's complexity, does the description cover enough for an agent to succeed on first attempt?
Given the tool's complexity (detecting apps and retrieving window info), no annotations, no output schema, and 1 parameter with full schema coverage, the description is moderately complete. It covers the what and how (automatic detection on port 9222) but lacks details on return values, error cases, or integration with sibling tools. It's adequate as a starting point but has clear gaps for effective agent use.
Complex tools with many parameters or behaviors need more documentation. Simple tools need less. This dimension scales expectations accordingly.
Does the description clarify parameter syntax, constraints, interactions, or defaults beyond what the schema provides?
The input schema has 1 parameter with 100% description coverage, so the schema already documents 'includeChildren' as a boolean to include child windows. The description does not add any parameter-specific details beyond what the schema provides, such as examples or implications of setting it true/false. With high schema coverage, the baseline is 3, and the description does not compensate with extra semantic value.
Input schemas describe structure but not intent. Descriptions should explain non-obvious parameter relationships and valid value ranges.
Does the description clearly state what the tool does and how it differs from similar tools?
The description clearly states the tool's purpose: 'Get information about running Electron applications and their windows.' It specifies the verb ('Get information') and resource ('running Electron applications and their windows'), and distinguishes from sibling tools like read_electron_logs or send_command_to_electron by focusing on window info rather than logs or commands. However, it doesn't explicitly differentiate from take_screenshot, which might also involve window info, keeping it from a perfect score.
Agents choose between tools based on descriptions. A clear purpose with a specific verb and resource helps agents select the right tool.
Does the description explain when to use this tool, when not to, or what alternatives exist?
The description implies usage by stating it 'Automatically detects any Electron app with remote debugging enabled (port 9222),' which suggests when to use it (when such apps are running). However, it lacks explicit guidance on when to use this tool vs. alternatives like read_electron_logs for logs or take_screenshot for visual data, and does not mention any exclusions or prerequisites beyond the debugging requirement.
Agents often have multiple tools that could apply. Explicit usage guidance like "use X instead of Y when Z" prevents misuse.
Read console logs and output from running Electron applications. Useful for debugging and monitoring app behavior.
| Name | Required | Description | Default |
|---|---|---|---|
| follow | No | Whether to follow/tail the logs | |
| lines | No | Number of recent lines to read (default: 100) | |
| logType | No | Type of logs to read |
Does the description disclose side effects, auth requirements, rate limits, or destructive behavior?
No annotations are provided, so the description carries the full burden of behavioral disclosure. It mentions the tool is for 'debugging and monitoring,' which suggests read-only behavior, but doesn't explicitly state whether it's safe, requires permissions, has rate limits, or details the output format. For a tool with no annotations, this leaves significant gaps in understanding its operational traits.
Agents need to know what a tool does to the world before calling it. Descriptions should go beyond structured annotations to explain consequences.
Is the description appropriately sized, front-loaded, and free of redundancy?
The description is concise and well-structured, consisting of two sentences that directly address purpose and usage without any wasted words. It is front-loaded with the core function and efficiently adds context, making it easy to parse and understand quickly.
Shorter descriptions cost fewer tokens and are easier for agents to parse. Every sentence should earn its place.
Given the tool's complexity, does the description cover enough for an agent to succeed on first attempt?
Given the tool's moderate complexity (3 parameters, no output schema, no annotations), the description is minimally adequate. It covers the purpose and hints at usage but lacks details on behavioral aspects like safety, permissions, or output format. Without annotations or an output schema, more context would be beneficial, but it meets a basic threshold for completeness.
Complex tools with many parameters or behaviors need more documentation. Simple tools need less. This dimension scales expectations accordingly.
Does the description clarify parameter syntax, constraints, interactions, or defaults beyond what the schema provides?
The input schema has 100% description coverage, with clear documentation for all parameters ('follow', 'lines', 'logType'), including an enum for 'logType'. The description adds no additional parameter information beyond what the schema provides. According to the rules, with high schema coverage (>80%), the baseline score is 3 when no param info is added in the description.
Input schemas describe structure but not intent. Descriptions should explain non-obvious parameter relationships and valid value ranges.
Does the description clearly state what the tool does and how it differs from similar tools?
The description clearly states the tool's purpose: 'Read console logs and output from running Electron applications.' It specifies the verb ('Read') and resource ('console logs and output from running Electron applications'), making the function evident. However, it doesn't explicitly distinguish this tool from its siblings (e.g., 'get_electron_window_info' or 'send_command_to_electron'), which would be needed for a score of 5.
Agents choose between tools based on descriptions. A clear purpose with a specific verb and resource helps agents select the right tool.
Does the description explain when to use this tool, when not to, or what alternatives exist?
The description provides some usage context by stating it's 'Useful for debugging and monitoring app behavior,' which implies when to use it. However, it doesn't offer explicit guidance on when to choose this tool over alternatives (e.g., vs. 'get_electron_window_info' for window info or 'send_command_to_electron' for commands), nor does it mention any exclusions or prerequisites, keeping it at an implied level.
Agents often have multiple tools that could apply. Explicit usage guidance like "use X instead of Y when Z" prevents misuse.
Send JavaScript commands to any running Electron application via Chrome DevTools Protocol.
Enhanced UI interaction commands:
'find_elements': Analyze all interactive elements (buttons, inputs, selects) with their properties
'click_by_text': Click elements by their visible text, aria-label, or title
'click_by_selector': Securely click elements by CSS selector
'fill_input': Fill input fields by selector, placeholder text, or associated label
'select_option': Select dropdown options by value or text
'send_keyboard_shortcut': Send keyboard shortcuts like 'Ctrl+N', 'Meta+N', 'Enter', 'Escape'
'navigate_to_hash': Safely navigate to hash routes (e.g., '#create', '#settings')
'get_page_structure': Get organized overview of page elements (buttons, inputs, selects, links)
'debug_elements': Get debugging info about buttons and form elements on the page
'verify_form_state': Check current form state and validation status
'get_title', 'get_url', 'get_body_text': Basic page information
'eval': Execute custom JavaScript code with enhanced error reporting
IMPORTANT: Arguments must be passed as an object with the correct properties:
Examples:
click_by_selector: {"selector": "button.submit-btn"}
click_by_text: {"text": "Submit"}
fill_input: {"placeholder": "Enter name", "value": "John Doe"}
fill_input: {"selector": "#email", "value": "user@example.com"}
send_keyboard_shortcut: {"text": "Enter"}
eval: {"code": "document.title"}
Use 'get_page_structure' or 'debug_elements' first to understand available elements, then use specific interaction commands.
| Name | Required | Description | Default |
|---|---|---|---|
| args | No | Arguments for the command - must be an object with appropriate properties based on the command type | |
| command | Yes | Command to send to the Electron process |
Does the description disclose side effects, auth requirements, rate limits, or destructive behavior?
With no annotations provided, the description carries full burden and does well by disclosing behavioral traits: it explains the enhanced UI interaction capabilities, emphasizes secure clicking ('Securely click'), safe navigation ('Safely navigate'), and enhanced error reporting for eval. However, it doesn't mention authentication needs, rate limits, or what happens on command failure.
Agents need to know what a tool does to the world before calling it. Descriptions should go beyond structured annotations to explain consequences.
Is the description appropriately sized, front-loaded, and free of redundancy?
The description is well-structured with clear sections: purpose statement, command listing, argument format explanation, examples, and usage guidance. While comprehensive, some redundancy exists (e.g., listing all commands could be more concise). Every sentence adds value, but it's slightly longer than optimal.
Shorter descriptions cost fewer tokens and are easier for agents to parse. Every sentence should earn its place.
Given the tool's complexity, does the description cover enough for an agent to succeed on first attempt?
Given the tool's complexity (multiple command types, nested parameters) and no output schema, the description does well by explaining command behaviors, argument structures, and usage patterns. However, it doesn't describe return values or error responses, which would be helpful since there's no output schema. The coverage is strong but not fully complete for such a multifaceted tool.
Complex tools with many parameters or behaviors need more documentation. Simple tools need less. This dimension scales expectations accordingly.
Does the description clarify parameter syntax, constraints, interactions, or defaults beyond what the schema provides?
Schema description coverage is 100%, so baseline is 3. The description adds significant value by explaining the command types and their required argument structures with concrete examples. It clarifies that 'Arguments must be passed as an object with the correct properties' and provides specific mappings between commands and their parameter needs (e.g., click_by_selector requires selector, fill_input requires value).
Input schemas describe structure but not intent. Descriptions should explain non-obvious parameter relationships and valid value ranges.
Does the description clearly state what the tool does and how it differs from similar tools?
The description explicitly states 'Send JavaScript commands to any running Electron application via Chrome DevTools Protocol' - a specific verb ('Send') with clear resource ('JavaScript commands to Electron application'). It distinguishes from siblings like get_electron_window_info (info gathering), read_electron_logs (log reading), and take_screenshot (screenshot capture) by focusing on interactive command execution.
Agents choose between tools based on descriptions. A clear purpose with a specific verb and resource helps agents select the right tool.
Does the description explain when to use this tool, when not to, or what alternatives exist?
The description provides explicit guidance on when to use specific commands: 'Use get_page_structure or debug_elements first to understand available elements, then use specific interaction commands.' It also distinguishes between different command types (e.g., click_by_text vs click_by_selector) and provides clear examples for when to use each approach.
Agents often have multiple tools that could apply. Explicit usage guidance like "use X instead of Y when Z" prevents misuse.
Take a screenshot of any running Electron application window. Returns base64 image data for AI analysis. No files created unless outputPath is specified.
| Name | Required | Description | Default |
|---|---|---|---|
| outputPath | No | Path to save the screenshot (optional, defaults to temp directory) | |
| windowTitle | No | Specific window title to screenshot (optional) |
Does the description disclose side effects, auth requirements, rate limits, or destructive behavior?
With no annotations provided, the description carries the full burden. It discloses key behavioral traits: that it returns base64 image data, creates no files by default, and only creates files when outputPath is specified. However, it doesn't mention potential limitations like what happens if no Electron windows are running, performance characteristics, or error conditions.
Agents need to know what a tool does to the world before calling it. Descriptions should go beyond structured annotations to explain consequences.
Is the description appropriately sized, front-loaded, and free of redundancy?
The description is perfectly concise with three sentences that each earn their place: states the action and target, specifies the return format and purpose, and clarifies the file creation behavior. No wasted words, front-loaded with the core functionality.
Shorter descriptions cost fewer tokens and are easier for agents to parse. Every sentence should earn its place.
Given the tool's complexity, does the description cover enough for an agent to succeed on first attempt?
For a screenshot tool with 2 parameters, 100% schema coverage, and no output schema, the description provides good context about what the tool does and its behavior. However, without annotations or output schema, it could benefit from more detail about the return format structure or error handling, though the base64 return is mentioned.
Complex tools with many parameters or behaviors need more documentation. Simple tools need less. This dimension scales expectations accordingly.
Does the description clarify parameter syntax, constraints, interactions, or defaults beyond what the schema provides?
Schema description coverage is 100%, so the schema already documents both parameters well. The description adds minimal value beyond the schema - it mentions that outputPath is optional and defaults to temp directory (already in schema) and implies windowTitle is optional (already in schema). Baseline 3 is appropriate when schema does the heavy lifting.
Input schemas describe structure but not intent. Descriptions should explain non-obvious parameter relationships and valid value ranges.
Does the description clearly state what the tool does and how it differs from similar tools?
The description clearly states the specific action ('Take a screenshot') and resource ('any running Electron application window'), distinguishing it from sibling tools like get_electron_window_info (which provides info) or send_command_to_electron (which sends commands). It explicitly mentions what the tool does and what it returns.
Agents choose between tools based on descriptions. A clear purpose with a specific verb and resource helps agents select the right tool.
Does the description explain when to use this tool, when not to, or what alternatives exist?
The description provides clear context about when to use this tool (for capturing screenshots of Electron apps for AI analysis) and mentions the optional outputPath parameter for file creation. However, it doesn't explicitly state when NOT to use it or name specific alternatives among the sibling tools.
Agents often have multiple tools that could apply. Explicit usage guidance like "use X instead of Y when Z" prevents misuse.
Recent tool additions, removals, and schema changes observed during successful MCP inspections.
v1.0.0get_electron_window_inforead_electron_logssend_command_to_electrontake_screenshotScored across 4 tools
The tool set has significant overlap and unclear boundaries. The first three tools (get_electron_window_info, read_electron_logs, send_command_to_electron) are distinct, but the 'Enhanced UI interaction commands' section contains 14 tools that are poorly differentiated. For example, 'debug_elements' and 'get_page_structure' seem to serve similar purposes, and 'click_by_text' vs 'click_by_selector' are just different targeting methods rather than distinct operations. This creates confusion about which tool to use for basic UI tasks.
The naming conventions are inconsistent and chaotic. The first three tools use snake_case with clear verb_noun patterns, but the UI interaction tools mix styles: some use snake_case ('click_by_text'), others use camelCase ('getPageStructure' in the description but 'get_page_structure' as the tool name), and some are just verbs ('eval'). There's no discernible pattern across the entire set, making it difficult to predict tool names.
With 17 total tools (3 core + 14 UI interaction), the count is borderline heavy for an Electron automation server. While Electron automation can justify many tools, the UI interaction section feels bloated with redundant or overly specific tools (e.g., separate tools for 'get_title', 'get_url', and 'get_body_text' instead of a unified 'get_page_info'). The count would be more appropriate if the UI tools were consolidated into fewer, more general-purpose tools.
For an Electron automation server, the tool surface is reasonably complete. It covers core areas: window detection, log reading, command execution, UI interaction (with extensive element targeting methods), and screenshots. The main gap is the lack of window management tools (resize, minimize, close windows) and application lifecycle control (launch/quit apps). However, the existing tools cover most common automation workflows, with the UI interaction section being particularly thorough despite its redundancy issues.
A comprehensive Model Context Protocol (MCP) server that enables AI assistants to interact with yo…
A Model Context Protocol server for Wix AI tools
Model Context Protocol server for the Apideck Unified API. Connect any MCP-compatible agent framework to 100+ accounting systems, HRIS platforms, file storage providers, and more through one integration. More information https://www.apideck.com/mcp-server
Enable secure connectivity between Sentry issues and debugging data, and LLM clients, using a Model Context Protocol (MCP) server.