
MCP ASCII Charts
# mcp-ascii-charts
[](https://www.npmjs.com/package/mcp-ascii-charts)
[](https://opensource.org/licenses/MIT)
[](https://github.com/gianlucamazza/mcp-ascii-charts/actions/workflows/ci.yml)
[](https://www.npmjs.com/package/mcp-ascii-charts)
[](https://github.com/gianlucamazza/mcp-ascii-charts)
A Model Context Protocol server for generating ASCII charts directly in your terminal.
## 🎯 Features
- **Pure ASCII charts** - Lightweight visualizations for terminal environments
- **MCP integration** - Compatible with Claude, Cursor, and other MCP clients
- **No GUI dependencies** - Perfect for servers and SSH environments
- **Highly customizable** - Configurable dimensions, colors, and styles
## 📊 Supported chart types
- **Line Chart** - Line graphs for temporal trends
- **Bar Chart** - Horizontal and vertical bar charts
- **Scatter Plot** - Scatter plots for data correlation
- **Histogram** - Distribution histograms
- **Sparkline** - Inline mini-charts
## 🚀 Quick installation
Available on [npm](https://www.npmjs.com/package/mcp-ascii-charts)
### Step 1: Install globally
```bash
# Install globally from npm (required for MCP servers)
npm install -g mcp-ascii-charts
# Or install from GitHub
npm install -g git+https://github.com/gianlucamazza/mcp-ascii-charts.git
```
### Step 2: Configure your MCP client
Add to your Claude Desktop configuration file:
**macOS**: `~/Library/Application Support/Claude/claude_desktop_config.json`
**Windows**: `%APPDATA%\Claude\claude_desktop_config.json`
**Linux**: `~/.config/Claude/claude_desktop_config.json`
```json
{
"mcpServers": {
"ascii-charts": {
"command": "mcp-ascii-charts"
}
}
}
```
### Step 3: Restart Claude Desktop
After configuration, restart Claude Desktop to load the MCP server.
## 💡 Usage examples
### Line chart
```text
Monthly Sales (2024)
100 ┤ ╭╮
90 ┤ ╭─╯╰╮
80 ┤ ╭─╯ ╰╮
70 ┤ ╭─╯ │
60 ┤ ╭──╯ ╰╮
50 ┤ ╭──╯ │
40 ┤ ╭──╯ ╰─
30 ┤ ╭──╯
20 ┤ ╭──╯
10 ┤ ╭──╯
0 ┼────────────────╯
Jan Feb Mar Apr May Jun Jul Aug Sep Oct Nov Dec
```
### Bar chart
```text
Team Performance
Frontend ████████████████████████████ 85%
Backend ██████████████████████ 67%
DevOps ████████████████ 54%
QA ██████████████████████████████████ 92%
```
## 🛠️ MCP tools
| Function | Description |
|----------|-------------|
| `create_line_chart` | Generate line charts for temporal data |
| `create_bar_chart` | Create horizontal/vertical bar charts |
| `create_scatter_plot` | Visualize correlations between variables |
| `create_histogram` | Show frequency distributions |
| `create_sparkline` | Mini-charts for compact dashboards |
## 📋 Parameters
```javascript
{
"data": [10, 25, 30, 45, 60],
"labels": ["Q1", "Q2", "Q3", "Q4", "Q5"],
"title": "Quarterly Growth",
"width": 60,
"height": 15,
"color": "blue"
}
```
## 🎨 Customization
- **Dimensions**: Configure width and height
- **Colors**: ANSI color support (12 colors available)
- **Flexible data input**: Arrays with optional labels
- **Unicode rendering**: Box-drawing characters for smooth visuals
## 🛠️ Development
```bash
# Clone the repository
git clone https://github.com/gianlucamazza/mcp-ascii-charts.git
cd mcp-ascii-charts
# Install dependencies
npm install
# Run in development mode
npm run dev
# Run tests
npm test
# Build for production
npm run build
```
## 📚 Documentation
- [Contributing Guidelines](CONTRIBUTING.md)
- [Changelog](CHANGELOG.md)
- [API Reference](https://github.com/gianlucamazza/mcp-ascii-charts/wiki)
## 🐛 Issues & Support
- [Report Issues](https://github.com/gianlucamazza/mcp-ascii-charts/issues)
- [Feature Requests](https://github.com/gianlucamazza/mcp-ascii-charts/issues/new?template=feature_request.md)
- [Bug Reports](https://github.com/gianlucamazza/mcp-ascii-charts/issues/new?template=bug_report.md)
## 📄 License
MIT License - see [LICENSE](LICENSE) file for details.
## 🙏 Contributing
Contributions are welcome! Please read our [Contributing Guidelines](CONTRIBUTING.md) for details on how to submit pull
requests, report issues, and contribute to the project.
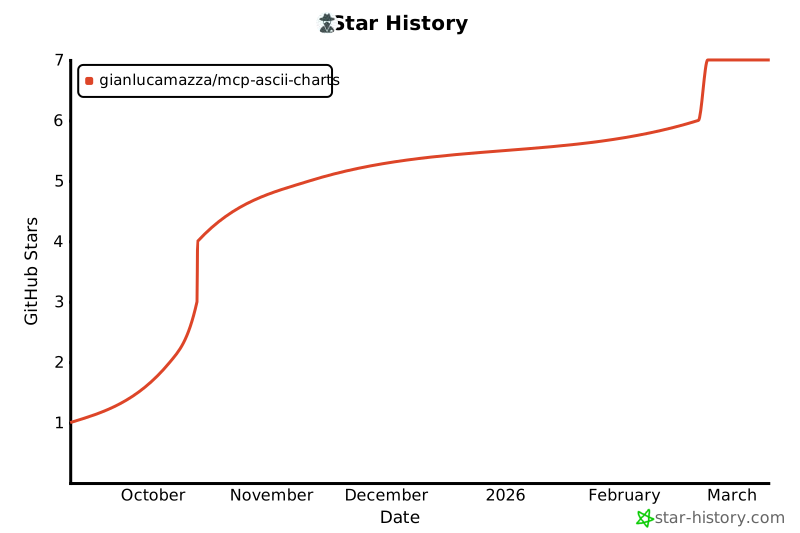
## ⭐ Star History
[](https://star-history.com/#gianlucamazza/mcp-ascii-charts&Date)
TDQS
Scored across 5 tools
Each tool has a clearly distinct purpose targeting a specific chart type: bar charts, histograms, line charts, scatter plots, and sparklines. The descriptions explicitly differentiate their use cases (e.g., 'frequency distribution' for histograms vs. 'temporal data visualization' for line charts), leaving no ambiguity for an agent to misselect.
All tool names follow a perfectly consistent 'create_*_chart/plot/line' pattern with snake_case, using 'create' as the verb and descriptive nouns (e.g., bar_chart, histogram, line_chart). This uniformity makes the set predictable and easy to understand at a glance.
With 5 tools, the server is well-scoped for generating ASCII charts, covering common chart types without bloat. Each tool earns its place by addressing a distinct visualization need, making the count appropriate for the domain's typical use cases.
The tool set provides complete coverage for ASCII chart generation, including bar charts, histograms, line charts, scatter plots, and sparklines. This covers the core chart types needed for data visualization, with no obvious gaps that would hinder an agent's ability to create relevant charts.