
Wireshark MCP
The Wireshark MCP server provides comprehensive network packet analysis capabilities by integrating Wireshark/tshark tools, enabling AI assistants to analyze pcap files, capture live traffic, and perform security analysis.
Packet Analysis: View packet summaries and detailed JSON information, extract raw hex/ASCII dumps, view packets in context, reassemble and follow complete TCP/UDP/TLS/HTTP streams with pagination, and search for patterns using string, hex, or regex matching.
Data Extraction: Extract specific protocol fields as tabular data with custom filtering, retrieve HTTP requests and DNS queries, list unique IP addresses, export embedded files from HTTP/SMB/TFTP traffic, and verify TLS decryption using keylog files.
Statistics & Reporting: Generate protocol hierarchy statistics, endpoint and conversation analysis, I/O graphs for traffic volume over time, expert information for anomaly detection (retransmissions, errors, warnings), and service response time metrics for HTTP, DNS, SMB and other protocols.
File Operations & Live Capture: Get detailed metadata for pcap files, merge multiple capture files, filter and save packets, list available network interfaces, and capture live traffic with duration, packet count, BPF filters, and ring buffer support.
Security Analysis: Check captured IP addresses against URLhaus threat intelligence feeds and scan for plaintext credentials in HTTP Basic Auth, FTP, and Telnet traffic.
Utilities: Decode common encodings (Base64, Hex, URL, Gzip, Deflate, Rot13) with auto-detection and generate ASCII charts for traffic volume and protocol hierarchy trees.
Supported Protocols: Network layer (Ethernet, IP, IPv6, TCP, UDP, SCTP, WLAN) and application layer (HTTP, HTTP/2, DNS, TLS/SSL, SMB, FTP, Telnet, TFTP, DICOM).
Provides tools for analyzing network traffic and pcap files, including packet summarization, deep packet dissection, stream reassembly, and automated extraction of HTTP requests, DNS queries, and credentials.
Click on "Install Server".
Wait a few minutes for the server to deploy. Once ready, it will show a "Started" state.
In the chat, type
@followed by the MCP server name and your instructions, e.g., "@Wireshark MCPanalyze capture.pcap and check for any plaintext credentials"
That's it! The server will respond to your query, and you can continue using it as needed.
Here is a step-by-step guide with screenshots.
What is this?
Wireshark MCP is an MCP Server that turns tshark into a structured analysis interface, then layers in optional Wireshark suite utilities such as capinfos, mergecap, editcap, dumpcap, and text2pcap when they are available. The result is a packet-analysis server that still works with only tshark, but gets stronger automatically on hosts with more of the Wireshark toolchain installed.
You:    "Find all DNS queries going to suspicious domains in this capture."
Claude: [calls wireshark_extract_dns_queries → wireshark_check_threats]
        "Found 3 queries to domains flagged by URLhaus: ..."
Prerequisites
Python 3.10+
Wireshark installed with
tsharktsharkis the only required Wireshark CLI dependencyOptional suite tools such as
capinfos,mergecap,editcap,dumpcap, andtext2pcapare auto-detected and enable extra MCP features when presentLive capture prefers
dumpcapwhen available, but falls back totsharkso a minimal installation still workstsharkon yourPATHis recommended, butwireshark-mcp installalso records detected absolute Wireshark tool paths for GUI clientsAny MCP-compatible client: Claude Desktop, Claude Code, Cursor, VS Code, etc.
1.0 Support Matrix
For v1.0, "stable" means the project commits to the following baseline:
Area | v1.0 baseline |
Operating systems | Windows, Linux, and macOS |
CI validation | Test suite runs on all three platforms; packaged CLI smoke tests run on all three platforms; real |
Python versions | 3.10, 3.11, 3.12, 3.13 |
Required Wireshark dependency |
|
Optional Wireshark suite tools |
|
Supported install paths |
|
User-facing verification |
|
If one of these baseline items stops working, that is a 1.0.x bug, not a "future enhancement".
Demo Videos
Install Demo
Play or download the install demo video
Analysis Demo
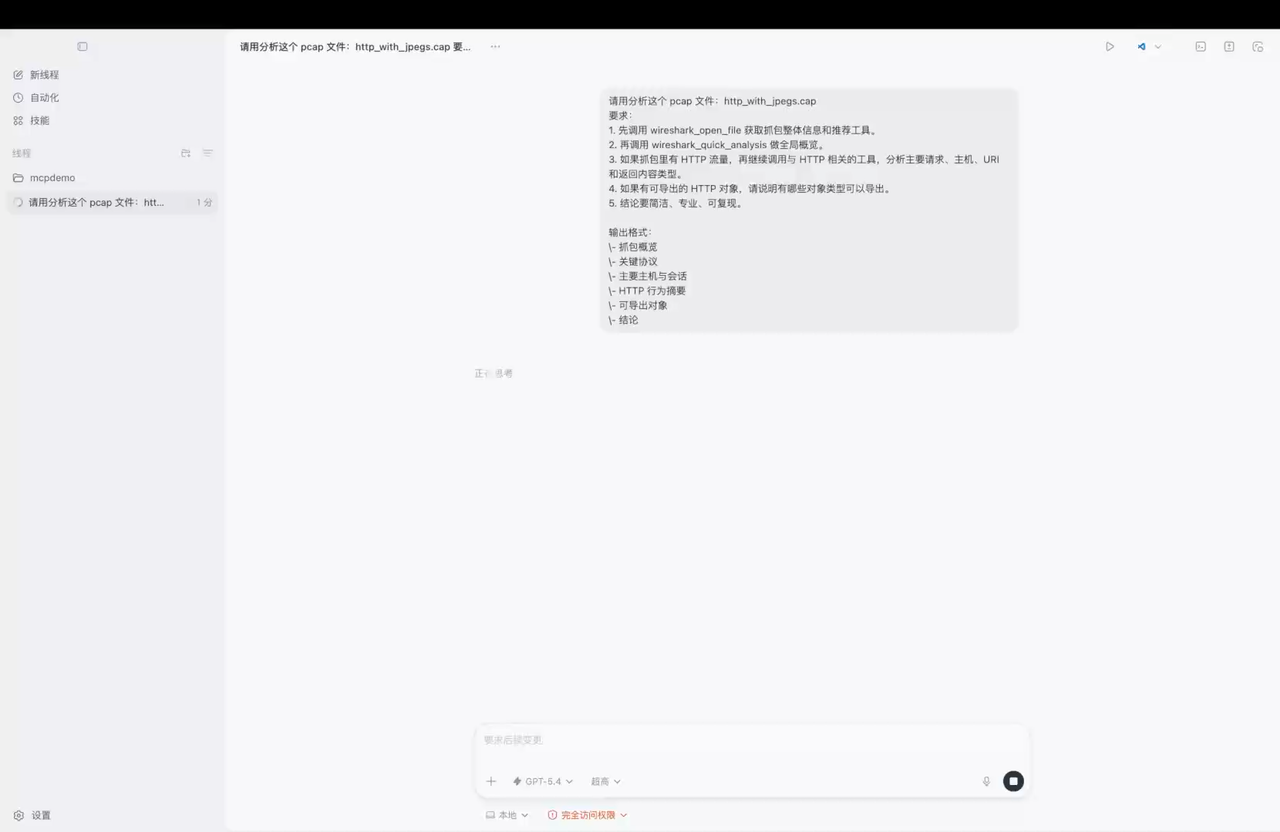
Play or download the analysis demo video
Installation
Option 1 — One-click install in Cursor (no pre-install needed)

Requires uv and Wireshark to be installed on your system.
Option 2 — pip install + auto-configure
pip install wireshark-mcpThen auto-configure all your MCP clients in one command:
wireshark-mcp installThat's it — restart your AI client and you're ready to go. 🎉
If anything still looks off, run:
wireshark-mcp doctorWhat does
installdo? It scans your system for known MCP client config files (Claude, Cursor, VS Code, etc.) and injects thewireshark-mcpserver entry. Existing settings are preserved. See Supported Clients for the full list.
pip install git+https://github.com/bx33661/Wireshark-MCP.git
wireshark-mcp install
wireshark-mcp uninstallHosted deployment
A hosted deployment is available on Fronteir AI.
Platform Setup
Use this section when you want the shortest reliable path to a working setup on each OS.
Install Python 3.10+.
Install Wireshark and make sure the
tsharkCLI is available.Install the package:
pip install wireshark-mcp
wireshark-mcp install
wireshark-mcp doctor
If you plan to use live capture, dumpcap is preferred when available.
Install Python 3.10+.
Install Wireshark or the distro package that provides
tshark.Install the package:
pip install wireshark-mcp
wireshark-mcp install
wireshark-mcp doctor
Live capture may require extra capture permissions depending on your distro. Offline .pcap analysis works as soon as tshark is available.
Install Python 3.10+.
Install Wireshark and keep the
TSharkcomponent enabled in the installer.In PowerShell or Command Prompt, run:
py -m pip install wireshark-mcp
wireshark-mcp install
wireshark-mcp doctor
The installer writes absolute Python and Wireshark tool paths for GUI MCP clients, which is especially helpful on Windows where GUI apps often do not inherit your shell environment.
Supported Clients
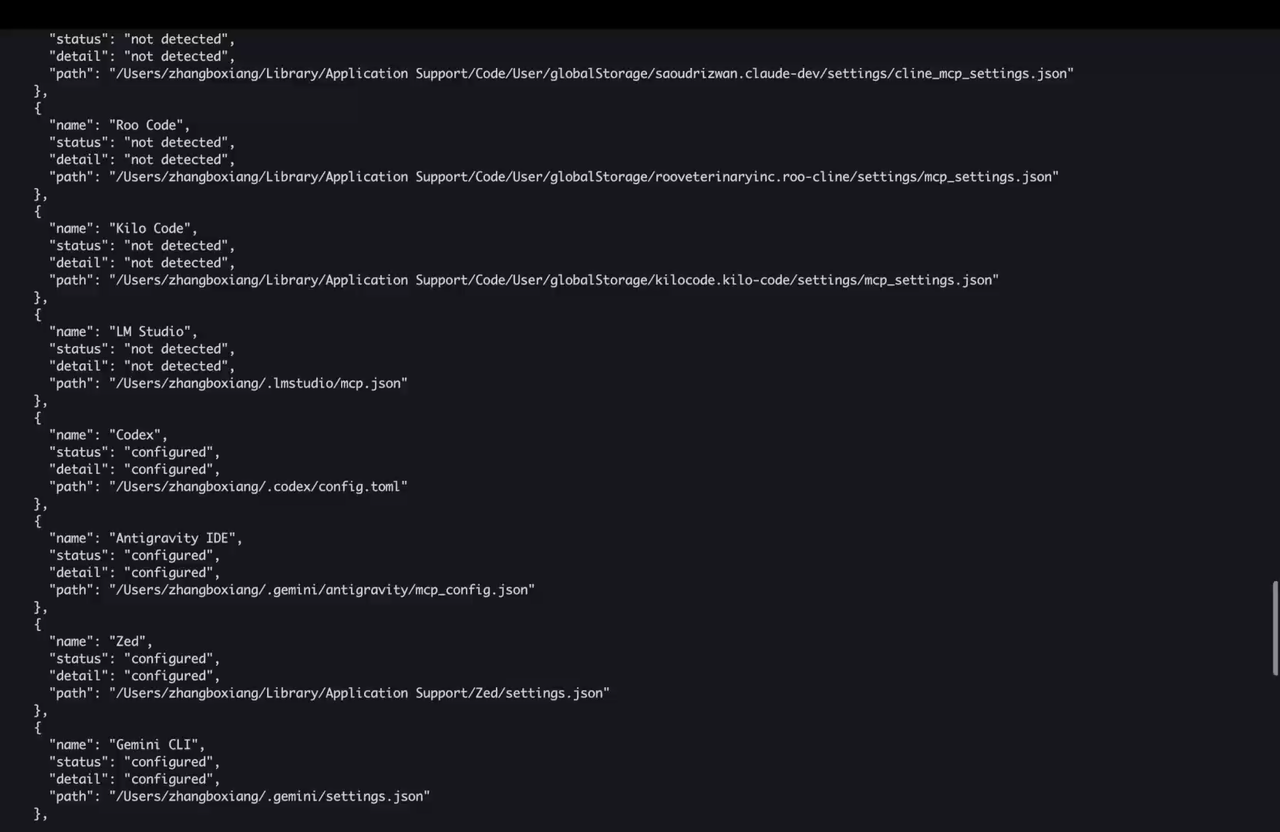
wireshark-mcp install auto-configures the following clients across macOS, Linux, and Windows:
Client | Config File |
Claude Desktop |
|
Claude Code |
|
Cursor |
|
VS Code |
|
VS Code Insiders |
|
Windsurf |
|
Cline |
|
Roo Code |
|
Kilo Code |
|
Antigravity IDE |
|
Zed |
|
LM Studio |
|
Warp |
|
Trae |
|
Gemini CLI |
|
Copilot CLI |
|
Amazon Q |
|
Codex |
|
For unsupported clients, run wireshark-mcp config to get the JSON snippet and paste it manually.
Configuration
Recommended: Auto-Configuration (one command)
pip install wireshark-mcp
wireshark-mcp install
This detects all installed MCP clients and writes the config automatically. Existing settings are preserved.
The generated entry always uses the current Python interpreter (python -u -m wireshark_mcp.server), forwards your current PATH, and stores detected absolute Wireshark tool paths when available, so GUI MCP clients do not need wireshark-mcp or tshark to be discoverable on their own.
⚠️ Restart your MCP client after running
installfor changes to take effect. 🔎 If analysis tools still fail to launch, runwireshark-mcp doctorto verify Python, required vs optional Wireshark CLI tools, and client config detection.
Manual Configuration
If you prefer to configure manually, start with:
wireshark-mcp configIf you use Codex:
wireshark-mcp config --format codex-tomlDetailed client-by-client instructions now live in docs/manual-configuration.md, including Claude Desktop, Claude Code, Cursor, VS Code, Codex, generic JSON-based clients, and Docker / SSE mode.
5-Minute Verification
After installation, this is the fastest way to confirm the setup is actually production-usable:
Check the package entrypoint:
wireshark-mcp --versionVerify Python and Wireshark tool discovery:
wireshark-mcp doctorAutomation-friendly form:
wireshark-mcp doctor --format jsonConfirm your client targets were detected:
wireshark-mcp clientsAutomation-friendly form:
wireshark-mcp clients --format jsonPrint the exact manual config for the current machine:
wireshark-mcp configIf you use Codex specifically, you can also render TOML directly:
wireshark-mcp config --format codex-tomlOpen your MCP client, attach a small
.pcap, and run:
Use wireshark_open_file on this capture, summarize the protocols you see, then run wireshark_quick_analysis.If all five checks work, the install is in the expected v1.0 steady state.
Operational Docs
Detailed steady-state and release docs now live under docs/:
Quick Start
Paste this into your AI client after pointing it at a pcap file:
Analyze <path/to/file.pcap> using the Wireshark MCP tools.

- Start with wireshark_open_file to get capture-wide context and recommended tools.
- Use wireshark_security_audit for a one-call security analysis.
- Or use wireshark_quick_analysis for a fast traffic overview.
- Drill into details with wireshark_follow_stream or wireshark_get_packet_details.
- Never guess — always verify with tools.
- Write findings to report.md.
Bundled Codex Skill
This repo also includes a Codex skill at skills/wireshark-traffic-analysis/.
It is designed for disciplined packet analysis: start with capture-wide context, choose the right workflow, validate with packet evidence, and finish with actionable next steps.
The latest revision is also grounded in official Wireshark documentation for protocol hierarchy, endpoints, conversations, expert info, display filters, and stream-follow behavior.
For cross-app discovery, the same skill is mirrored into .github/skills/ and .claude/skills/, with root instruction files (AGENTS.md, CLAUDE.md, GEMINI.md), GitHub Copilot instructions, and a machine-readable catalog at skills/manifest.json.
The skill supports these modes:
triagesecurityincident-responsetroubleshootctf
Example invocation:
Use $wireshark-traffic-analysis to investigate <file.pcap>.
Start in triage mode, escalate if you find suspicious behavior, and produce a concise report with exact filters, streams, frames, confidence, and next steps.
Compatibility Policy
The stable CLI for
1.xis the subcommand interface:serve,install,uninstall,doctor,config,clients.Legacy flags such as
--install,--doctor, and--configremain supported throughout1.x.wireshark_read_packetsremains available throughout1.xfor backwards compatibility, but it is deprecated and not recommended for new workflows.New packet-inspection workflows should use
wireshark_get_packet_listandwireshark_get_packet_details.
Prompt Engineering
LLMs perform best when you tell them to:
start with
wireshark_open_fileuse agentic tools first, then drill down
verify instead of guessing
produce a structured report
Ready-to-paste prompt templates for security audits, CTF work, and performance troubleshooting now live in docs/prompt-engineering.md.
Tools
Tool | Description |
| One-call security audit: 8-phase analysis (threat intel, credential scan, port scan, DNS tunnel, cleartext, anomalies) with risk scoring (0-100) and recommendations |
| One-call traffic overview: file info, protocol distribution, top talkers, conversations, hostnames, anomaly summary, suggested next steps |
| Smart file opener: analyzes pcap content and recommends the most relevant tools while keeping the MCP tool surface stable |
| Toolchain capability report: required, recommended, and optional Wireshark suite tools visible to the current MCP server |
💡 These tools replace the need to manually chain 5-10 tool calls. Just call one and get a complete report.
Tool | Description |
| Paginated packet list with display filter and custom column support |
| Full JSON dissection of a single frame, with optional layer filtering to cut token usage |
| Raw Hex + ASCII dump (Wireshark's "Packet Bytes" pane) |
| View N packets before and after a frame for contextual debugging |
| Deprecated compatibility tool retained for |
| Reassemble a full TCP / UDP / HTTP stream with pagination and search |
| Pattern search across raw bytes or decoded fields (Regex supported) |
Tool | Description |
| Extract any tshark fields as a table |
| HTTP method, URI, and host for every request |
| All DNS queries in the capture |
| All unique source, destination, or both IP addresses |
| Extract embedded files (HTTP, SMB, TFTP, etc.) |
| Confirm TLS decryption using a keylog file |
Tool | Description |
| Protocol Hierarchy Statistics — see what protocols dominate |
| All endpoints sorted by traffic volume |
| Communication pairs with byte/packet counts |
| Traffic volume over time (spot DDoS, scans, bursts) |
| Wireshark's expert analysis: errors, warnings, notes |
| SRT stats for HTTP, DNS, and other protocols |
Tool | Description |
| File metadata via |
| Merge multiple captures into one file |
| Apply a display filter and save matching packets to a new file |
| List available network interfaces |
| Start a live capture (duration, packet count, BPF filter, ring buffer) |
These tools are additive. The server still starts with only tshark, and only advertises or uses the extra workflows below when the corresponding Wireshark companion binaries are present.
Tool | Description |
| Trim a capture to a timestamp window using |
| Split a capture by packet count or interval using |
| Shift packet timestamps by a relative offset using |
| Remove duplicate packets using |
| Convert ASCII or hex dumps into capture files using |
Tool | Description |
| Cross-reference captured URLs and hostnames against URLhaus threat intelligence |
| Detect plaintext credentials in HTTP Basic Auth, FTP, and Telnet |
| Detect SYN, FIN, NULL, and Xmas port scans with configurable threshold |
| Detect DNS tunneling (long queries, TXT abuse, subdomain entropy) |
| Detect DoS/DDoS patterns (SYN flood, ICMP/UDP flood, DNS amplification) |
| Comprehensive anomaly analysis: cleartext protocols, unusual ports, expert warnings |
Tool | Description |
| TLS version, cipher suite, SNI, and certificate info from Client/Server Hello |
| TCP retransmissions, duplicate ACKs, zero window, resets, out-of-order analysis |
| ARP spoofing detection: IP-MAC conflicts, gratuitous ARP floods |
| SMTP email metadata: sender, recipient, mail server info |
| DHCP lease information: assigned IPs, hostnames, DNS servers |
Tool | Description |
| Auto-detect and decode Base64, Hex, URL encoding, Gzip, Deflate, Rot13, and more |
| ASCII bar chart of traffic over time — spot DDoS or scan patterns instantly |
| ASCII protocol tree — visual overview of what's in the capture |
Note: Security, Protocol, and Threat tools stay available for the whole session.
wireshark_open_filerecommends which ones are most relevant for the current capture.
MCP Resources
Resource URI | Description |
| Complete display filter syntax cheatsheet with common examples |
| Protocol field name reference for filters and extraction |
| Recommended analysis workflows and tips |
| Current required, recommended, and optional Wireshark suite capabilities |
MCP Prompts
Prompt | Description |
| Full security audit workflow: threat intel, credential scan, attack detection |
| Network performance analysis: TCP health, response times, bottlenecks |
| CTF challenge solver: flag search, stream analysis, steganography checks |
| IR workflow: triage, IOC extraction, attack timeline, containment |
| Quick traffic summary with protocol breakdown and visualization |
Why Wireshark MCP?
There are other network analysis MCP servers out there, but Wireshark MCP was built with a few core goals:
Feature | Wireshark MCP | Others |
One-command install ( | ✅ | ❌ |
Agentic workflows (one-call security audit) | ✅ | ❌ |
Capture-aware recommendations with stable tool surface | ✅ | ❌ |
40+ specialized analysis tools | ✅ | 5-10 |
Threat intelligence integration | ✅ | ❌ |
Smart Python env detection | ✅ | ❌ |
18+ MCP client support | ✅ | Manual |
Troubleshooting
Symptom | What it usually means | What to do |
| Wireshark or the CLI component is not installed, or the path is not discoverable | Install Wireshark with |
MCP client sees the server but tool calls fail to launch | The GUI client is missing runtime env vars or absolute tool paths | Rerun |
Live capture fails but offline | Capture permissions or | Use offline capture files first; if you need live capture, grant the required OS-specific capture permissions |
| Optional Wireshark suite tools are not installed | This is not fatal; the server still works with |
Your client is not in the supported list | Auto-install only covers known config formats | Run |
Development
Install dev dependencies:
pip install -e ".[dev]"Test with the MCP Inspector (opens a local web UI to call tools interactively):
npx -y @modelcontextprotocol/inspector uv run wireshark-mcpRun the test suite:
uv run python -m pytest tests/ -vLint & type check:
uv run python -m ruff check src/ tests/
uv run python -m mypy --package wireshark_mcp --ignore-missing-imports --no-namespace-packages
Docker:
docker compose up -d
# Pcap files go in ./pcaps/ (mounted as /data)
CLI options:
wireshark-mcp                          # Start the stdio MCP server
wireshark-mcp serve --transport sse --host 0.0.0.0 --port 8080
wireshark-mcp install                  # Auto-configure all detected MCP clients
wireshark-mcp install --client codex   # Target a specific client
wireshark-mcp uninstall
wireshark-mcp doctor                   # Human-readable diagnostics
wireshark-mcp doctor --format json     # Machine-readable diagnostics
wireshark-mcp clients                  # Human-readable client detection
wireshark-mcp clients --format json    # Machine-readable client detection
wireshark-mcp config                   # Print JSON config for manual setup
wireshark-mcp config --format codex-toml
wireshark-mcp --version
Legacy flags such as --install, --doctor, and --config remain supported for backwards compatibility.
See CONTRIBUTING.md for the full development setup guide.
Latest Blog Posts
MCP directory API
We provide all the information about MCP servers via our MCP API.
curl -X GET 'https://glama.ai/api/mcp/v1/servers/bx33661/Wireshark-MCP'
If you have feedback or need assistance with the MCP directory API, please join our Discord server