Click on "Install Server".
Wait a few minutes for the server to deploy. Once ready, it will show a "Started" state.
In the chat, type
@followed by the MCP server name and your instructions, e.g., "@Perfetto MCPanalyze the trace at /data/trace.perfetto-trace for com.example.app to find memory leaks"
That's it! The server will respond to your query, and you can continue using it as needed.
Here is a step-by-step guide with screenshots.

Perfetto MCP
Turn natural language into powerful Perfetto trace analysis
A Model Context Protocol (MCP) server that transforms natural-language prompts into focused Perfetto analyses. Quickly explain jank, diagnose ANRs, spot CPU hot threads, uncover lock contention, and find memory leaks – all without writing SQL.
✨ Features
Natural Language → SQL: Ask questions in plain English, get precise Perfetto queries
ANR Detection: Automatically identify and analyze Application Not Responding events
Performance Analysis: CPU profiling, frame jank detection, memory leak detection
Thread Contention: Find synchronization bottlenecks and lock contention
Binder Profiling: Analyze IPC performance and slow system interactions

📋 Prerequisites
Python 3.13+ (macOS/Homebrew):
brew install python@3.13uv (recommended):
brew install uv
🚀 Getting Started
Or add to ~/.cursor/mcp.json (global) or .cursor/mcp.json (project):
Run this command. See Claude Code MCP docs for more info.
Or edit ~/claude.json (macOS) or %APPDATA%\Claude\claude.json (Windows):
or add to .vscode/mcp.json (project) or run "MCP: Add Server" command:
Enable in GitHub Copilot Chat's Agent mode.
Edit ~/.codex/config.toml:
Local Install (development server)
📖 How to Use
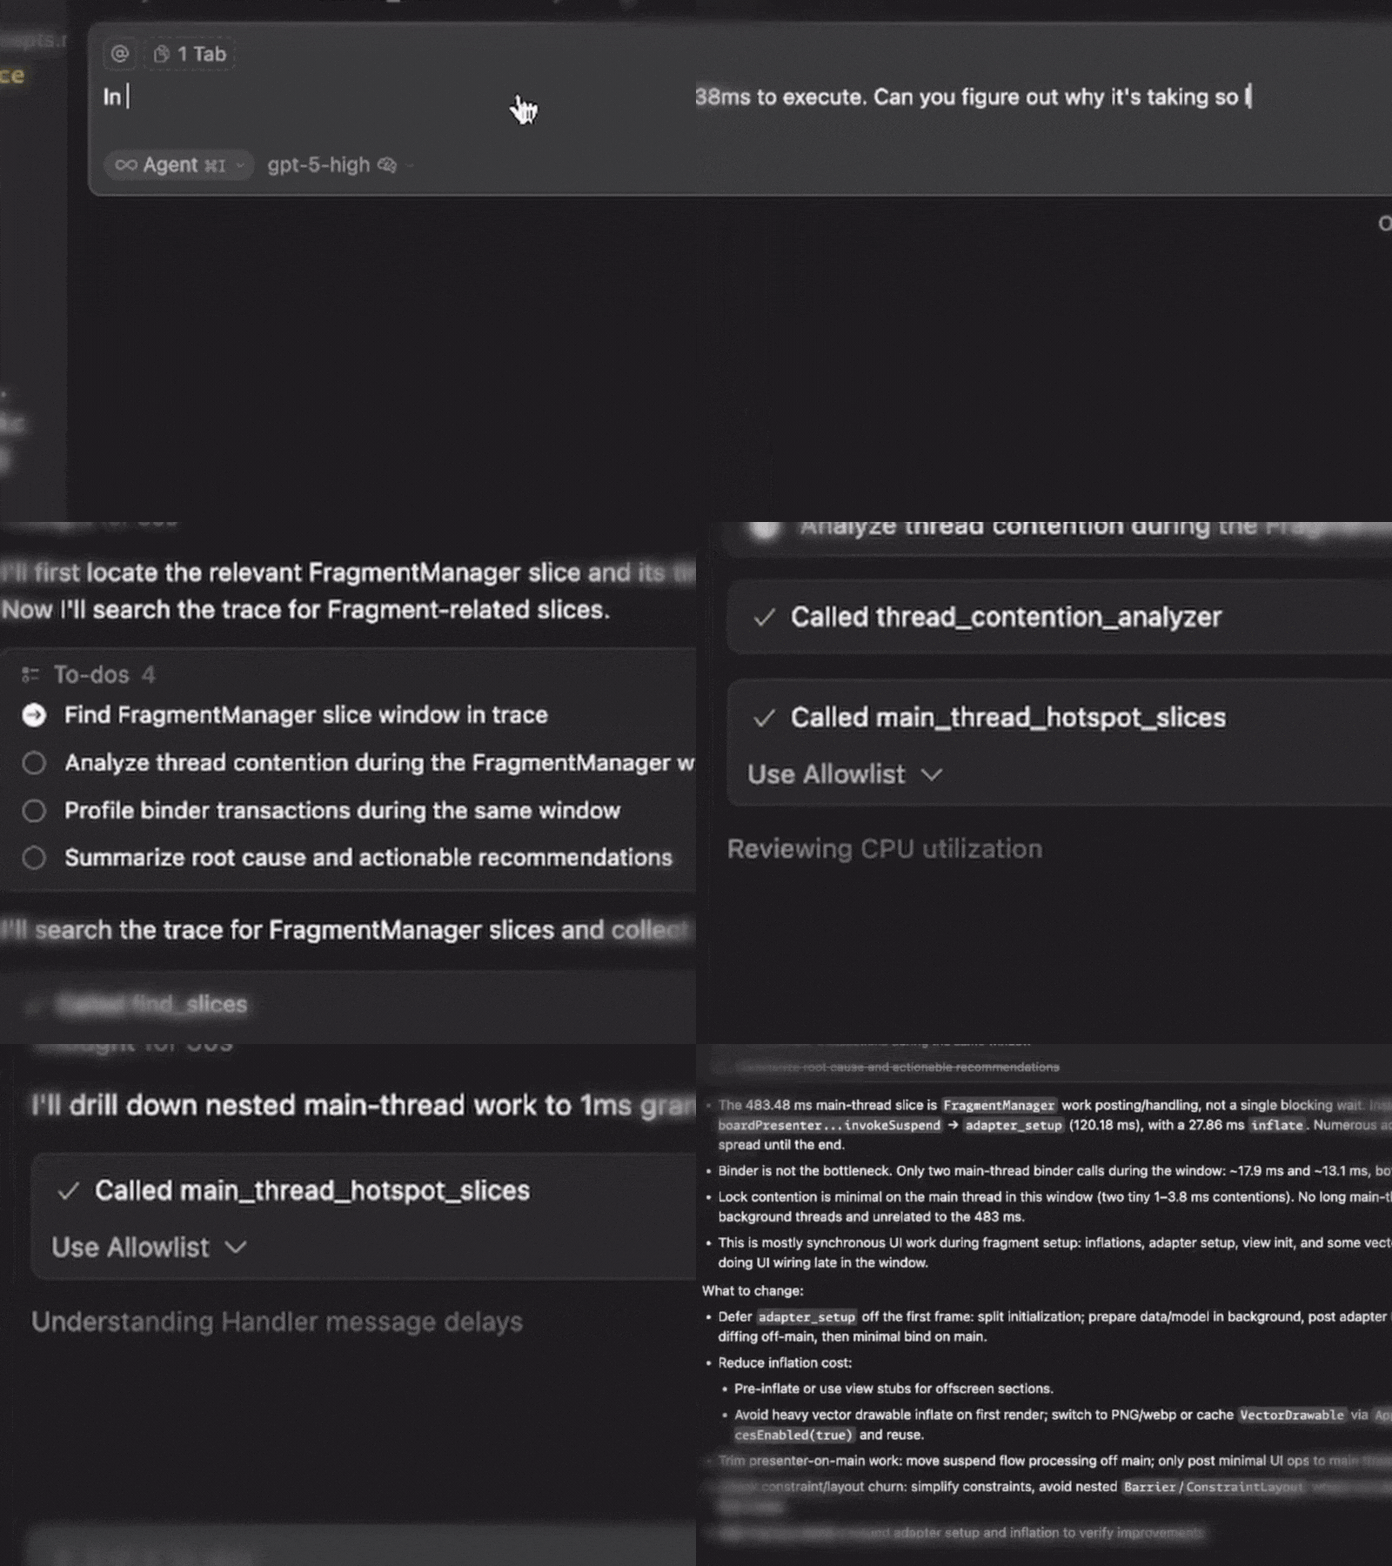
Example starting prompt:
In the perfetto trace, I see that the FragmentManager is taking 438ms to execute. Can you figure out why it's taking so long?
Required Parameters
Every tool needs these two inputs:
Parameter | Description | Example |
trace_path | Absolute path to your Perfetto trace |
|
process_name | Target process/app name |
|
In Your Prompts
Be explicit about the trace and process, prefix your prompt with:
"Use perfetto trace
Optional Filters
Many tools support additional filtering (but let your LLM handle that):
time_range:
{start_ms: 10000, end_ms: 25000}Tool-specific thresholds:
min_block_ms,jank_threshold_ms,limit
🛠️ Available Tools
🔎 Exploration & Discovery
Tool | Purpose | Example Prompt |
| Survey slice names and locate hot paths | "Find slice names containing 'Choreographer' and show top examples" |
| Run custom PerfettoSQL for advanced analysis | "Run custom SQL to correlate threads and frames in the first 30s" |
🚨 ANR Analysis
Note: Helpful if the recorded trace contains ANR
Tool | Purpose | Example Prompt |
| Find ANR events with severity classification | "Detect ANRs in the first 10s and summarize severity" |
| Deep-dive ANR causes with ranked likelihood | "Analyze ANR root cause around 20,000 ms and rank likely causes" |
🎯 Performance Profiling
Tool | Purpose | Example Prompt |
| Thread-level CPU usage and scheduling | "Profile CPU usage by thread and flag the hottest threads" |
| Find longest-running main thread operations | "List main-thread hotspots >50 ms during 10s–25s" |
📱 UI Performance
Tool | Purpose | Example Prompt |
| Identify frames missing deadlines | "Find janky frames above 16.67 ms and list the worst 20" |
| Overall frame health metrics | "Summarize frame performance and report jank rate and P99 CPU time" |
🔒 Concurrency & IPC
Tool | Purpose | Example Prompt |
| Find synchronization bottlenecks | "Find lock contention between 15s–30s and show worst waits" |
| Analyze Binder IPC performance | "Profile slow Binder transactions and group by server process" |
💾 Memory Analysis
Tool | Purpose | Example Prompt |
| Find sustained memory growth patterns | "Detect memory-leak signals over the last 60s" |
| Identify memory-hogging classes | "Analyze heap dominator classes and list top offenders" |
Output Format
All tools return structured JSON with:
Summary: High-level findings
Details: Tool-specific results
Metadata: Execution context and any fallbacks used
📚 Resources
Trace Processor Python API - Perfetto's Python interface
Perfetto SQL Syntax - SQL reference for custom queries
📄 License
Apache 2.0 License. See LICENSE for details.