mcp-highcharts
Render interactive Highcharts charts inline in AI chat — VS Code, GitHub Copilot, Claude Desktop, or any MCP client with MCP Apps support.


Setup
Click a badge above, or add to your MCP config:
{
  "mcp": {
    "servers": {
      "highcharts": {
        "command": "npx",
        "args": ["-y", "mcp-highcharts@latest"]
      }
    }
  }
}
Add to claude_desktop_config.json:
{
  "mcpServers": {
    "highcharts": {
      "command": "npx",
      "args": ["-y", "mcp-highcharts@latest"]
    }
  }
}
npx mcp-highcharts@latest --http          # http://localhost:3001/mcp
PORT=8080 npx mcp-highcharts@latest --http  # custom port
Related MCP server: Chart-Output MCP Server
Tools
Tool | Description |
render_chart
| Any chart type — line, bar, pie, scatter, heatmap, sankey, gauge, treemap, wordcloud, and 60+ more |
render_stock_chart
| Financial charts with navigator, range selector, and 40+ technical indicators |
render_dashboard
| Multi-component layouts with charts, KPIs, and data grids |
render_map
| Choropleth maps, map bubbles, map points (auto-fetches map data from CDN) |
render_gantt
| Project timelines with tasks, dependencies, and milestones |
render_grid
| Standalone data tables with sorting, pagination, and formatting |
All tools accept the full Highcharts Options API.
Prompts
Prompt | What it does |
chart_from_data
| Paste data → get the best chart |
dashboard_layout
| Scaffold a dashboard |
stock_analysis
| Candlestick + volume + indicators |
comparison_chart
| Side-by-side comparison patterns |
project_timeline
| Gantt with dependencies |
live_chart
| Live-updating chart from a data URL |
Configuration
Theming
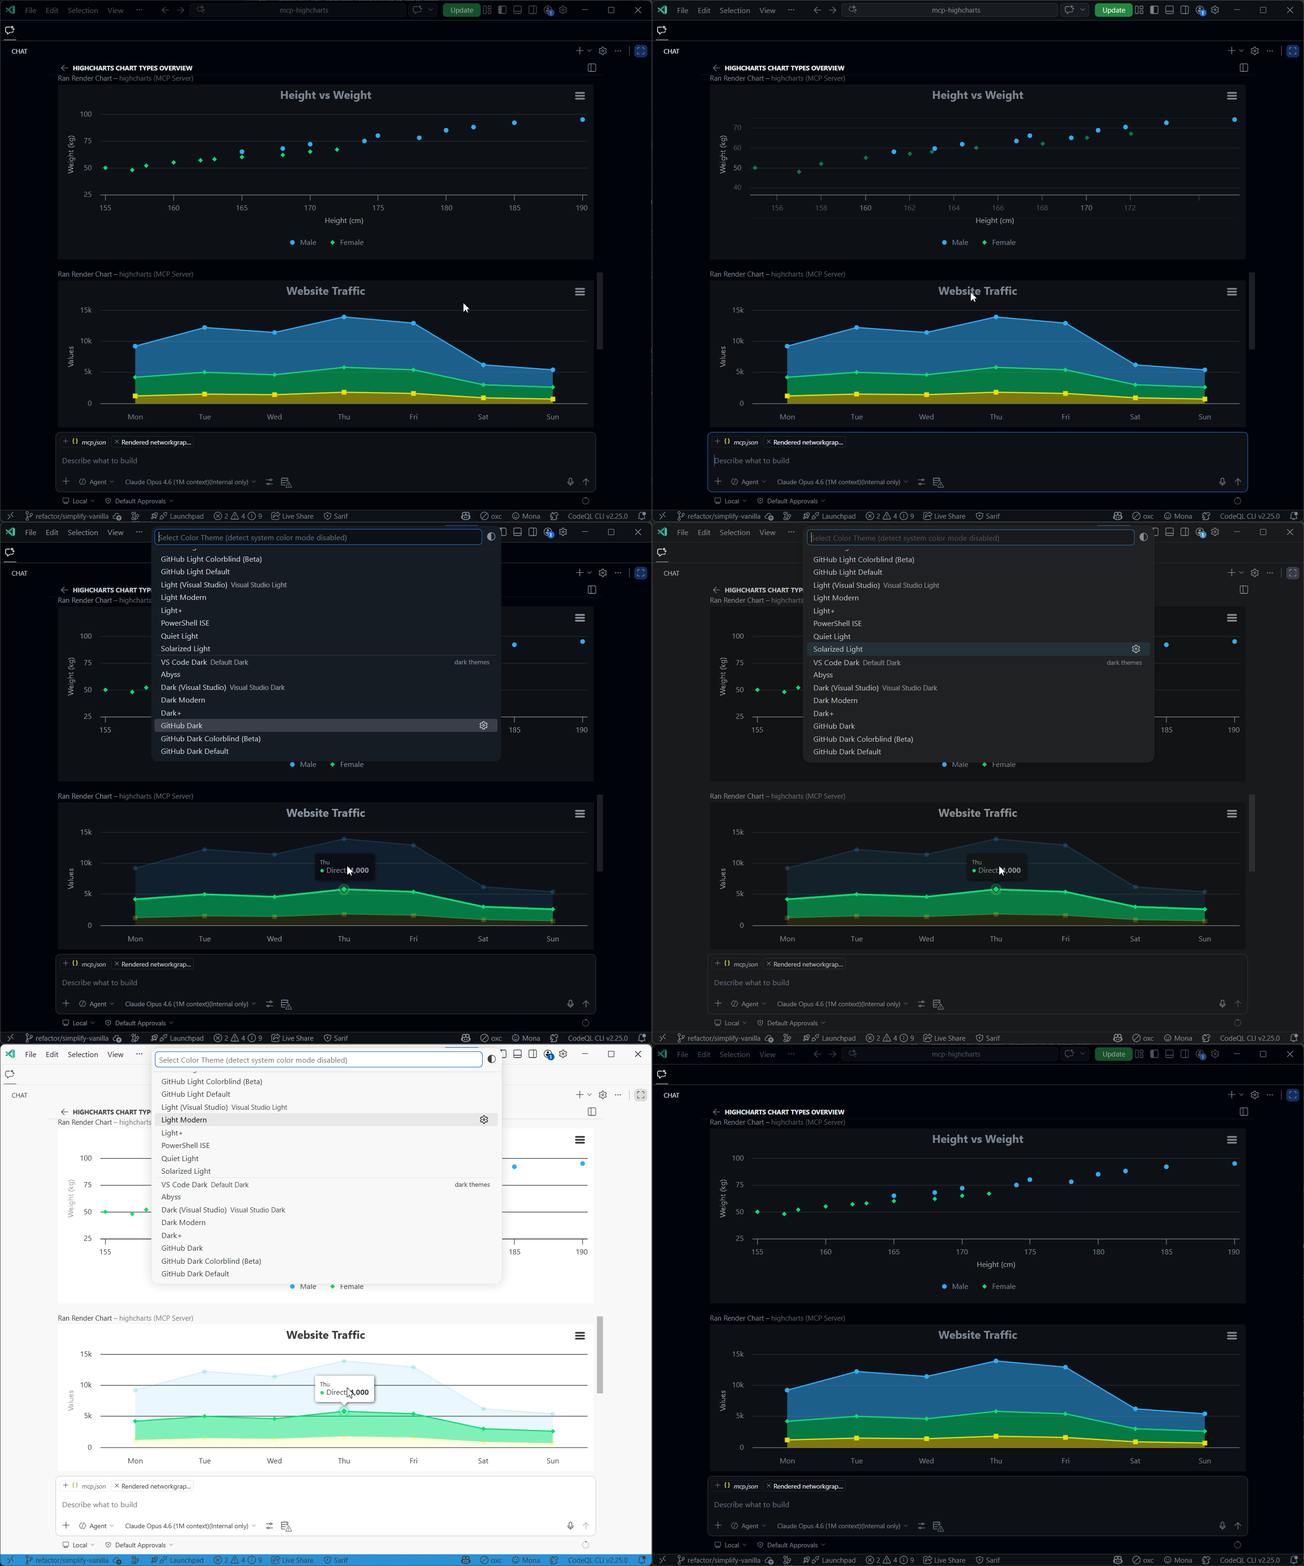
Charts auto-adapt to host light/dark mode. Override with environment variables:
{
  "env": {
    "HIGHCHARTS_THEME": "dark-unica",
    "HIGHCHARTS_OPTIONS": "./my-theme.json"
  }
}
HIGHCHARTS_OPTIONS accepts .json, .js, .mjs, .ts, or inline JSON.
Built-in themes: adaptive (default), avocado, brand-dark, brand-light, dark-blue, dark-green, dark-unica, gray, grid, grid-light, high-contrast-dark, high-contrast-light, sand-signika, skies, sunset
Schema depth
Controls how much type information is sent to the LLM:
{ "env": { "SCHEMA_DEPTH": "1" } }
Depth | Description |
0
| Property names only — zero context overhead |
1 (default)
| Top-level types + descriptions + examples |
2
| One level of typed children |
3
| Two levels deep — complete recursive Highcharts type tree |
Data sources
For live-updating charts, use the Highcharts data module with data.csvURL and data.enablePolling: true.
Image export (non-app fallback)
For MCP clients that don't support MCP Apps, enable server-side image export to include a PNG screenshot of each chart in the tool response:
{
  "env": {
    "IMAGE_EXPORT": "true"
  }
}
Charts are rendered as PNG and returned as base64 image content blocks. The interactive MCP app is still included for capable clients.
Rendering strategy (automatic):
Local (Puppeteer) — if highcharts-export-server is installed, charts render locally via a headless browser. No network calls, fastest option.
Remote fallback — if local isn't available, chart config is POSTed to the Highcharts Export Server.
To enable local rendering, install the optional peer dependency:
npm install highcharts-export-server
To use a custom remote export server:
{
  "env": {
    "IMAGE_EXPORT": "true",
    "EXPORT_SERVER_URL": "https://your-export-server.example.com/"
  }
}
You can also enable it programmatically: createServer({ imageExport: true }).
Note: Image export works for standard charts, stock charts, and Gantt charts. Dashboards, data grids, and maps with string-based map keys (e.g. "custom/world") are not exportable and will return text-only results.
Development
npm install
node scripts/generate-from-tree.mjs --multi   # generate Zod schemas at depths 0, 1, 2
npm run build
npm test
Project structure
main.ts                  Entry point (stdio + HTTP transports)
server.ts                MCP server — tool registrations and handlers
src/
  export-image.ts        Server-side PNG export (local Puppeteer + remote fallback)
  input-schema.ts        Depth-based schema selection + LLM-friendly overrides
  mcp-app.ts             Client-side Highcharts rendering
  module-loader.ts       Dynamic Highcharts module loading
  generated/             Auto-generated from Highcharts API (do not edit)
    highcharts-depth-{0,1,2}.gen.ts   Zod schemas at each depth
    module-map.json                   Chart type → Highcharts module mapping
scripts/
  generate-from-tree.mjs   Generate Zod schemas from Highcharts tree.json
  generate-module-map.mjs  Generate module-map.json from Highcharts
  example-providers.mjs    Example extraction for schema generation
  measure-schema.ts        Measure tool context size at each depth
Chart types, module mappings, and schemas are auto-generated from the installed Highcharts version — just npm update highcharts and regenerate.
License
MIT

