lighthouse-mcp
Servidor MCP de Lighthouse
Un servidor MCP que envuelve la herramienta Lighthouse de Google para ayudar a medir varias métricas de rendimiento de las páginas web.
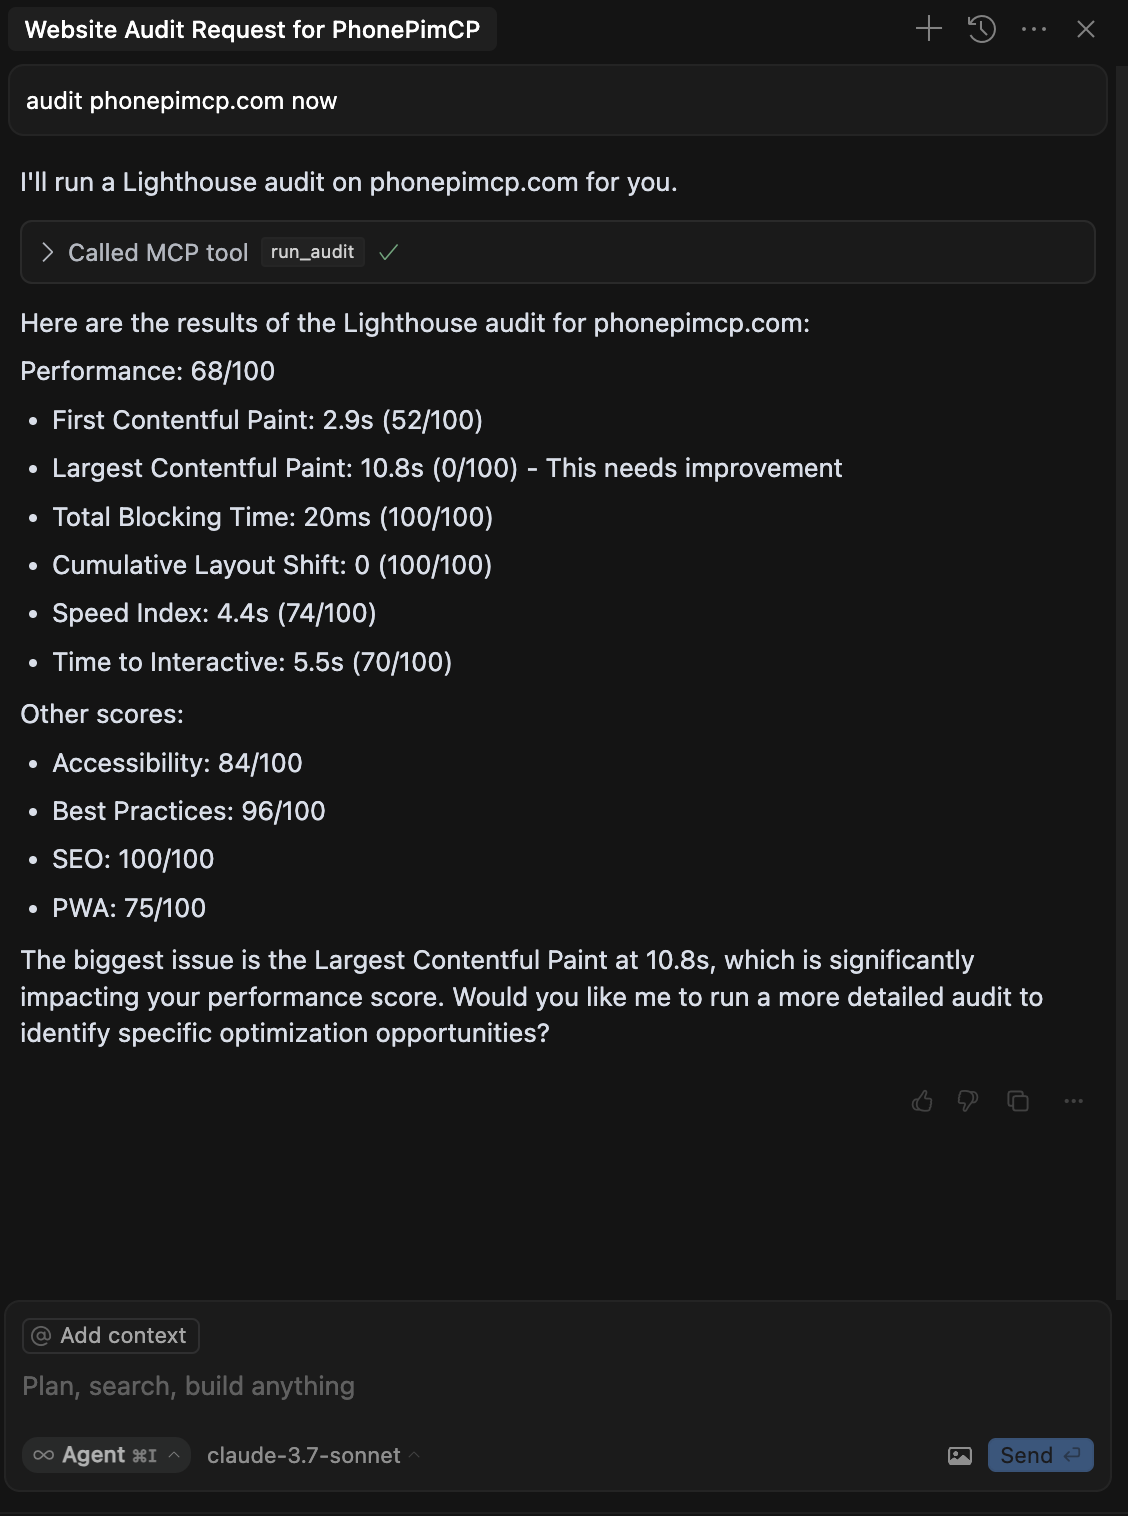
Características
Ejecute auditorías completas de Lighthouse en cualquier URL
Obtenga puntuaciones y métricas de rendimiento
Configurar la emulación del dispositivo (móvil/escritorio)
Controlar la limitación de la red
Seleccionar categorías de auditoría específicas
Related MCP server: LightScout MCP
Instalación
Opción 1: Usar npx (recomendado)
Puede ejecutar la herramienta directamente usando npx sin instalación:
npx lighthouse-mcpOpción 2: Instalación global
Instalar el paquete globalmente:
npm install -g lighthouse-mcpLuego ejecútalo:
lighthouse-mcpOpción 3: Desarrollo local
Clonar este repositorio
Instalar dependencias:
npm installConstruir el proyecto:
npm run buildEjecutar el servidor:
npm start
Configuración de MCP
Cuando se instala a través de npm (global o npx)
Agregue lo siguiente a su archivo de configuración de MCP:
{
"mcpServers": {
"lighthouse": {
"command": "npx",
"args": ["lighthouse-mcp"],
"disabled": false,
"autoApprove": []
}
}
}Al utilizar la versión de desarrollo local
Agregue lo siguiente a su archivo de configuración de MCP:
{
"mcpServers": {
"lighthouse": {
"command": "node",
"args": ["/absolute/path/to/lighthouse-mcp/build/index.js"],
"disabled": false,
"autoApprove": []
}
}
}Reemplace /absolute/path/to/lighthouse-mcp con la ruta real a este proyecto.
Herramientas disponibles
ejecutar_auditoría
Ejecute una auditoría completa de Lighthouse en una URL.
Parámetros:
url(obligatorio): La URL a auditarcategories(opcional): Matriz de categorías para auditar (predeterminado: todas)Opciones: "rendimiento", "accesibilidad", "mejores prácticas", "seo", "pwa"
device(opcional): Dispositivo a emular (predeterminado "móvil")Opciones: "móvil", "escritorio"
throttling(opcional): si se debe aplicar limitación de red (el valor predeterminado es verdadero)
Ejemplo:
{
"url": "https://example.com",
"categories": ["performance", "accessibility"],
"device": "desktop",
"throttling": false
}obtener_puntuación_de_rendimiento
Obtenga solo la puntuación de rendimiento de una URL.
Parámetros:
url(obligatorio): La URL a auditardevice(opcional): Dispositivo a emular (predeterminado "móvil")Opciones: "móvil", "escritorio"
Ejemplo:
{
"url": "https://example.com",
"device": "mobile"
}Ejemplo de uso
Una vez configurado el servidor MCP, puedes usarlo con Claude:
What's the performance score for example.com?Claude utilizará la herramienta get_performance_score para analizar el sitio web y devolver los resultados.
Requisitos
Node.js 16+
Navegador Chrome/Chromium (para Lighthouse)
Respaldos
Available Tools
2 toolsget_performance_scoreC
Get just the performance score for a URL
| Name | Required | Description | Default |
|---|---|---|---|
| url | Yes | URL to audit | |
| device | No | Device to emulate (defaults to mobile) |
TDQS
Does the description disclose side effects, auth requirements, rate limits, or destructive behavior?
With no annotations provided, the description carries the full burden of behavioral disclosure but offers minimal information. It doesn't describe whether this is a read-only operation, what authentication might be required, rate limits, error conditions, or what format the performance score returns. The description only states what the tool does, not how it behaves.
Agents need to know what a tool does to the world before calling it. Descriptions should go beyond structured annotations to explain consequences.
Is the description appropriately sized, front-loaded, and free of redundancy?
The description is extremely concise - a single sentence that directly states the tool's core functionality. There's zero waste or unnecessary elaboration, making it easy to parse and understand at a glance.
Shorter descriptions cost fewer tokens and are easier for agents to parse. Every sentence should earn its place.
Given the tool's complexity, does the description cover enough for an agent to succeed on first attempt?
For a tool with no annotations and no output schema, the description is insufficiently complete. It doesn't explain what 'performance score' entails (numeric value, rating scale, composite metric), doesn't mention the sibling tool relationship, and provides no behavioral context. Users need more information to effectively use this tool.
Complex tools with many parameters or behaviors need more documentation. Simple tools need less. This dimension scales expectations accordingly.
Does the description clarify parameter syntax, constraints, interactions, or defaults beyond what the schema provides?
With 100% schema description coverage, the input schema already fully documents both parameters (url and device). The description adds no additional parameter semantics beyond what's in the schema - it doesn't explain what 'performance score' means, how it's calculated, or provide context about the device parameter's impact. Baseline 3 is appropriate when the schema does the heavy lifting.
Input schemas describe structure but not intent. Descriptions should explain non-obvious parameter relationships and valid value ranges.
Does the description clearly state what the tool does and how it differs from similar tools?
The description clearly states the tool's purpose with a specific verb ('Get') and resource ('performance score for a URL'), making it immediately understandable. However, it doesn't distinguish this tool from its sibling 'run_audit' - both likely relate to performance analysis but with different outputs or scopes.
Agents choose between tools based on descriptions. A clear purpose with a specific verb and resource helps agents select the right tool.
Does the description explain when to use this tool, when not to, or what alternatives exist?
The description provides no guidance about when to use this tool versus its sibling 'run_audit' or any alternatives. It doesn't mention prerequisites, constraints, or appropriate contexts for usage beyond the basic functionality stated.
Agents often have multiple tools that could apply. Explicit usage guidance like "use X instead of Y when Z" prevents misuse.
run_auditC
Run a Lighthouse audit on a URL
| Name | Required | Description | Default |
|---|---|---|---|
| url | Yes | URL to audit | |
| device | No | Device to emulate (defaults to mobile) | |
| categories | No | Categories to audit (defaults to all) | |
| throttling | No | Whether to apply network throttling (defaults to true) |
TDQS
Does the description disclose side effects, auth requirements, rate limits, or destructive behavior?
With no annotations, the description must disclose behavioral traits, but it only says 'Run a Lighthouse audit'. It does not mention what the audit produces (e.g., scores, report), whether it is time-consuming, if it requires network access, or any side effects. The agent gets no behavioral context beyond the obvious mutation-like action.
Agents need to know what a tool does to the world before calling it. Descriptions should go beyond structured annotations to explain consequences.
Is the description appropriately sized, front-loaded, and free of redundancy?
The description is a single, efficient sentence with no wasted words. It is appropriately short, though it could be improved by front-loading key behavior. It earns a 4 because conciseness is good, but it sacrifices necessary detail for brevity.
Shorter descriptions cost fewer tokens and are easier for agents to parse. Every sentence should earn its place.
Given the tool's complexity, does the description cover enough for an agent to succeed on first attempt?
Given the tool has 4 parameters, no annotations, and no output schema, the description is far from complete. It does not explain what the audit returns, how to interpret results, or any edge cases. An agent would not know what to do with the output or how the audit behaves. This is a significant gap for a tool with this complexity.
Complex tools with many parameters or behaviors need more documentation. Simple tools need less. This dimension scales expectations accordingly.
Does the description clarify parameter syntax, constraints, interactions, or defaults beyond what the schema provides?
Schema description coverage is 100%, so each parameter has its own description in the schema (e.g., device, categories, throttling). The tool description adds no additional parameter meaning, but per the baseline rule, high schema coverage warrants a score of 3. The description does not compensate with extra context but also doesn't need to.
Input schemas describe structure but not intent. Descriptions should explain non-obvious parameter relationships and valid value ranges.
Does the description clearly state what the tool does and how it differs from similar tools?
The description clearly states the action ('Run a Lighthouse audit') and the target ('on a URL'). It is a specific verb+resource combination, but it does not differentiate from the sibling tool get_performance_score, which likely also deals with Lighthouse scores. So it's clear but lacks sibling distinction.
Agents choose between tools based on descriptions. A clear purpose with a specific verb and resource helps agents select the right tool.
Does the description explain when to use this tool, when not to, or what alternatives exist?
No guidance is provided on when to use this tool versus get_performance_score. The description does not mention any prerequisites, constraints, or alternative scenarios. It simply states what it does, leaving the agent to guess when this is the appropriate choice.
Agents often have multiple tools that could apply. Explicit usage guidance like "use X instead of Y when Z" prevents misuse.
Tool Schema Changelog
Recent tool additions, removals, and schema changes observed during successful MCP inspections.
1 tool update
v0.1.17- Changed
run_audit1 field changed- changed
Input schema / properties / categories / items / enumPrevious value: -[ - "performance", - "accessibility", - "best-practices", - "seo", - "pwa" -]New value: +[ + "performance", + "accessibility", + "best-practices", + "seo" +]
2 tool updates
v1.0.0- First observed
get_performance_score - First observed
run_audit
TDQS
Scored across 2 tools
Both tools relate to Lighthouse audits, but they have distinct purposes: run_audit executes a full audit, while get_performance_score focuses on retrieving only the performance metric. However, get_performance_score is essentially a subset of run_audit, so an agent might be unsure when to use one over the other without additional context.
Both tool names follow a clear verb_noun pattern (run_audit, get_performance_score) with consistent snake_case and action-first style. The naming is predictable and unambiguous in structure.
With only 2 tools, the server feels under-scoped for a Lighthouse MCP. A typical Lighthouse workflow would expect a richer set of operations, such as fetching full report details, comparing scores, or handling multiple categories. The minimal count limits utility and feels thin.
The tool surface is severely incomplete for a Lighthouse server. It only covers running an audit and extracting the performance score, omitting other standard audit categories (accessibility, SEO, best practices) and report retrieval. Agents would hit dead ends if they need any other Lighthouse data.
Maintenance
Related MCP Connectors
- gtmetrixOAuthcom.gtmetrix
Analyze web performance and get optimization insights from GTmetrix, directly in your AI workflow.
Run SEO + AI-visibility (GEO) audits from Claude, Cursor & other AI clients.
SEO & marketing toolkit for AI agents: GA4, Search Console, AdSense, GTM, PageSpeed, Trends.
Find what slows your website down. Run a free check in Claude Code, Cursor or ChatGPT. No account needed to try it. Save your result with a free Nimo account, then check again after your fixes. No card needed. Learn more: https://heynimo.com/for/coding-assistants
Related MCP Servers
- AlicenseNot gradedqualityDmaintenanceEnables AI models to perform Google Lighthouse website performance analysis, including Core Web Vitals, accessibility, SEO audits, and actionable optimization recommendations. Provides comprehensive web performance insights through natural language interactions.1,203 npm4MIT
- AlicenseAqualityDmaintenanceCore Web Vitals analysis powered by Lighthouse. Four tools: analyze a URL, compare two URLs, check against thresholds, or crawl an entire site. Works with Claude Code, Cursor, Windsurf, and any MCP-compatible AI tool.415 npmMIT
- AlicenseNot gradedqualityDmaintenanceEnables AI assistants to control and inspect a live Chrome browser for automated web debugging, performance analysis, and Lighthouse audits. It allows agents to capture screenshots, monitor network requests, and measure Core Web Vitals using plain-English prompts.1,060,392 npmApache 2.0
- AlicenseAqualityDmaintenanceEnables AI agents to monitor website performance by scanning sites, retrieving Core Web Vitals, detecting regressions, and receiving AI-powered optimization recommendations.109 npmMIT