
diagonaldiagrams
# diagonaldiagrams
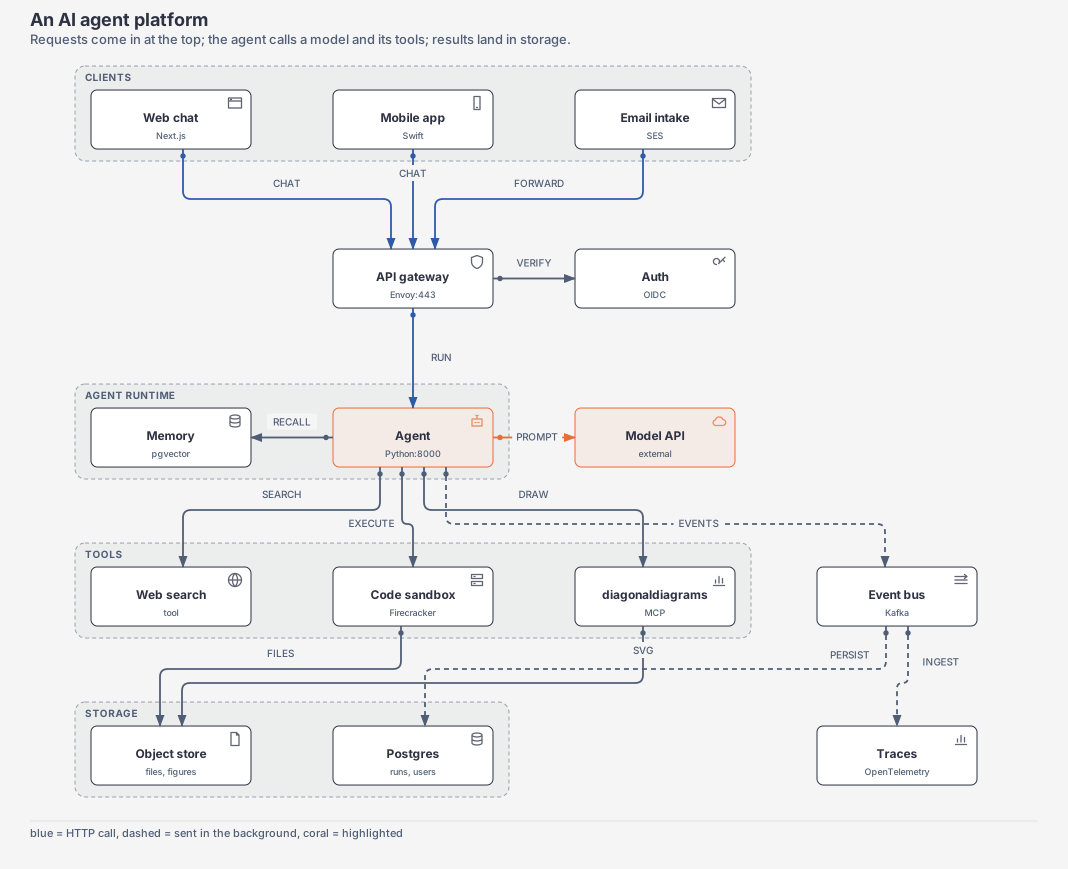
Diagrams and charts your agent can draw, and check before it shows you. One command takes a short spec, Mermaid, or a CSV, lays it out, draws an SVG, and audits the drawing for labels on labels, arrows through boxes, and text that spills.
**[Try it in the browser](https://lucas19919.github.io/diagonaldiagrams/)**: the real engine, running in your browser.
## Install
Claude Code, as a plugin. This adds the drawing skill:
```text
/plugin marketplace add lucas19919/diagonaldiagrams
/plugin install diagonaldiagrams@diagonaldiagrams
```
Any agent, as a command. This puts `diagonaldiagrams` on PATH:
```bash
pip install git+https://github.com/lucas19919/diagonaldiagrams
```
As MCP tools (`render`, `describe`, `validate`, `audit`, `export`, `infer`):
```bash
claude mcp add --scope user diagonaldiagrams -- diagonaldiagrams mcp
```
Or clone it and run `py -3 graph.py describe` (Windows) or `python3 graph.py describe`. Agents can follow [`.agents/skills/diagonaldiagrams-install/SKILL.md`](.agents/skills/diagonaldiagrams-install/SKILL.md) to install, and [`.agents/skills/graph-engine/SKILL.md`](.agents/skills/graph-engine/SKILL.md) to draw.
## One command
```text
diagonaldiagrams mermaid flow.mmd -o out/flow.svg
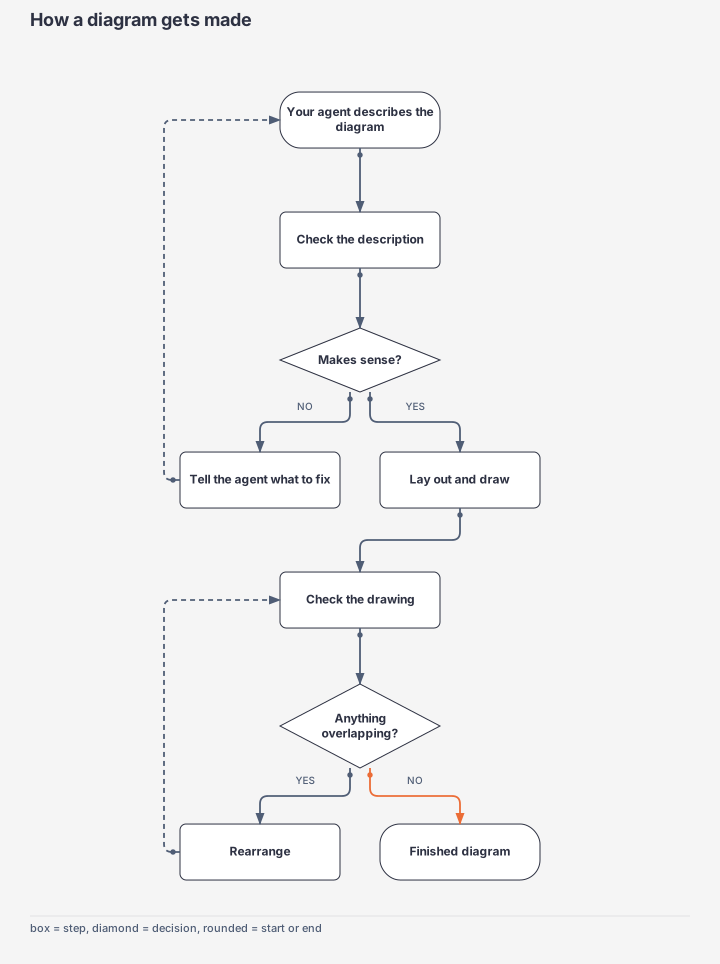
{"ok": true, "svg": "out/flow.svg", "html": "out/flow.html", "receipt": "out/flow.graph.json", "items": 9,
"layout": ["row 1: Your agent describes the diagram", "row 2: Check the description", "row 3: Makes sense? (decision)", ...]}
```
It checks the input, draws, audits the drawing, and prints one line of JSON. `ok: false` comes with errors, each with a `fix`; change the input and run it again. `layout` describes the drawn structure, so an agent can confirm it without looking at a picture.
The audit reads the finished SVG: labels on labels, labels too wide for their box or off the canvas, boxes on boxes, arrows through a box or across a label, two arrows on one line, and nodes inside a frame they don't belong to. When it finds a problem it can fix, the layout repairs itself. It reads any SVG, so `diagonaldiagrams audit` also checks a figure an agent wrote by hand.
## Input
| Command | Input | Draws |
| --- | --- | --- |
| `mermaid` | Mermaid `flowchart`, `sequenceDiagram`, or `erDiagram` | Picks `flow`, `seq`, or `schema` |
| `flow` | JSON | A decision flow, with frames (`groups`) and icons |
| `arch` | JSON | Services and the calls between them |
| `seq` | JSON | A sequence of messages |
| `schema` | JSON | Tables and their relations |
| `bar`, `line`, `scatter` | CSV | Comparisons, trends, relationships |
| `geo` | CSV or GeoJSON | Places on a built-in coastline |
| `chart <type>` | CSV or JSON | About 60 more: sankey, gantt, heatmap, treemap, box, radar, math, ... |
`describe <type>` prints the contract for any type. Long names wrap inside their boxes. Loops are drawn back up the outside. Built-in icons (`describe icons`) cover users, databases, servers, queues, and more; in Mermaid, write `fa:fa-database`.
## Output
| File | Contents |
| --- | --- |
| `OUT.svg` | The drawing. Title and subtitle are on the figure; points and bars have hover tooltips. |
| `OUT.html` | The same figure, plus Copy SVG, Export SVG, and Export PNG. |
| `OUT.graph.json` | The receipt. `export` redraws from it. |
`export OUT --to png|pdf|svg|drawio|excalidraw` writes other formats. draw.io and Excalidraw exports keep boxes, frames, and the routed arrows attached to their boxes, so a person can open the figure and drag things around. PNG and PDF use cairosvg if installed, else headless Edge or Chrome.
## Measured
Five ways for an agent to draw the same flowchart, at 5, 11, 20 and 40 steps, two runs each, each run a fresh Claude Sonnet agent.
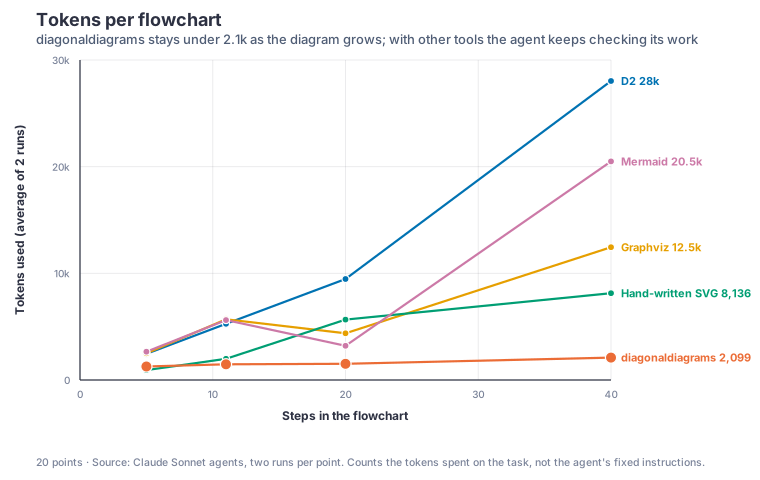
Tokens per flowchart, mean of two runs:
| Steps | diagonaldiagrams | Hand-written SVG | Graphviz | Mermaid CLI | D2 |
| --- | --- | --- | --- | --- | --- |
| 5 | **1.3k** | 0.9k | 2.5k | 2.7k | 2.5k |
| 11 | **1.5k** | 2.0k | 5.7k | 5.6k | 5.3k |
| 20 | **1.5k** | 5.7k | 4.4k | 3.2k | 9.5k |
| 40 | **2.1k** | 8.1k | 12.5k | 20.5k | 28.0k |
All eight runs per approach:
| | Tokens | Calls | Screenshots | Time |
| --- | --- | --- | --- | --- |
| diagonaldiagrams | **12.7k** | **29** | **0** | **6 min** |
| Hand-written SVG | 33.4k | 51 | 2 | 26 min |
| Graphviz | 50.1k | 91 | 4 | 28 min |
| Mermaid CLI | 63.9k | 115 | 42 | 31 min |
| D2 | 90.5k | 170 | 23 | 38 min |
What the runs show:
- Every approach produced a figure without overlapping text; the difference is what it cost to get there. With another tool the agent renders a PNG and looks, or writes its own geometry checks, and that cost grows with the figure. With diagonaldiagrams it reads the verdict and the outline, and took no screenshots in any run.
- Hand-written SVG is cheapest at 5 steps, because those agents mostly never looked at their output (see below).
- Where others do better: at 20 and 40 steps diagonaldiagrams draws one tall column. The Mermaid agents spent much of their extra tokens rearranging 40 steps into side-by-side stages, which reads better.
How it was run:
- Every run got the same task: a process described in prose, the number of steps, "clean, readable, no overlapping text", save `figure.svg`, and reply with the path and any failed commands. Only the first lines differ: which tool, and the command to run it.
- Tools: mermaid-cli 12 using the system Edge; Graphviz 16.1 as the official WebAssembly build; D2 0.7 from its official npm package (dagre layout); diagonaldiagrams with its skill; and no tool at all.
- Counted: the run's own tokens, meaning what the agent wrote, what came back to it, and screenshots at Claude's image rate. Left out: the harness (system prompt, tool definitions, reminders), which is the same whatever the task; the final report; and thinking, which transcripts hide. `scripts/bench_tokens.py` recounts any run from its transcript.
- Caveats. Two runs per point, and single runs differ by up to 2×. The no-tool prompt said not to use any renderer, and most agents took that to mean they should not look either. Graphviz and D2, as installed, wrote SVG only and there was no image viewer, so several agents spent calls looking for one. Twenty agents ran at once and shared one browser pane. All agents were Claude Sonnet.
## Gallery
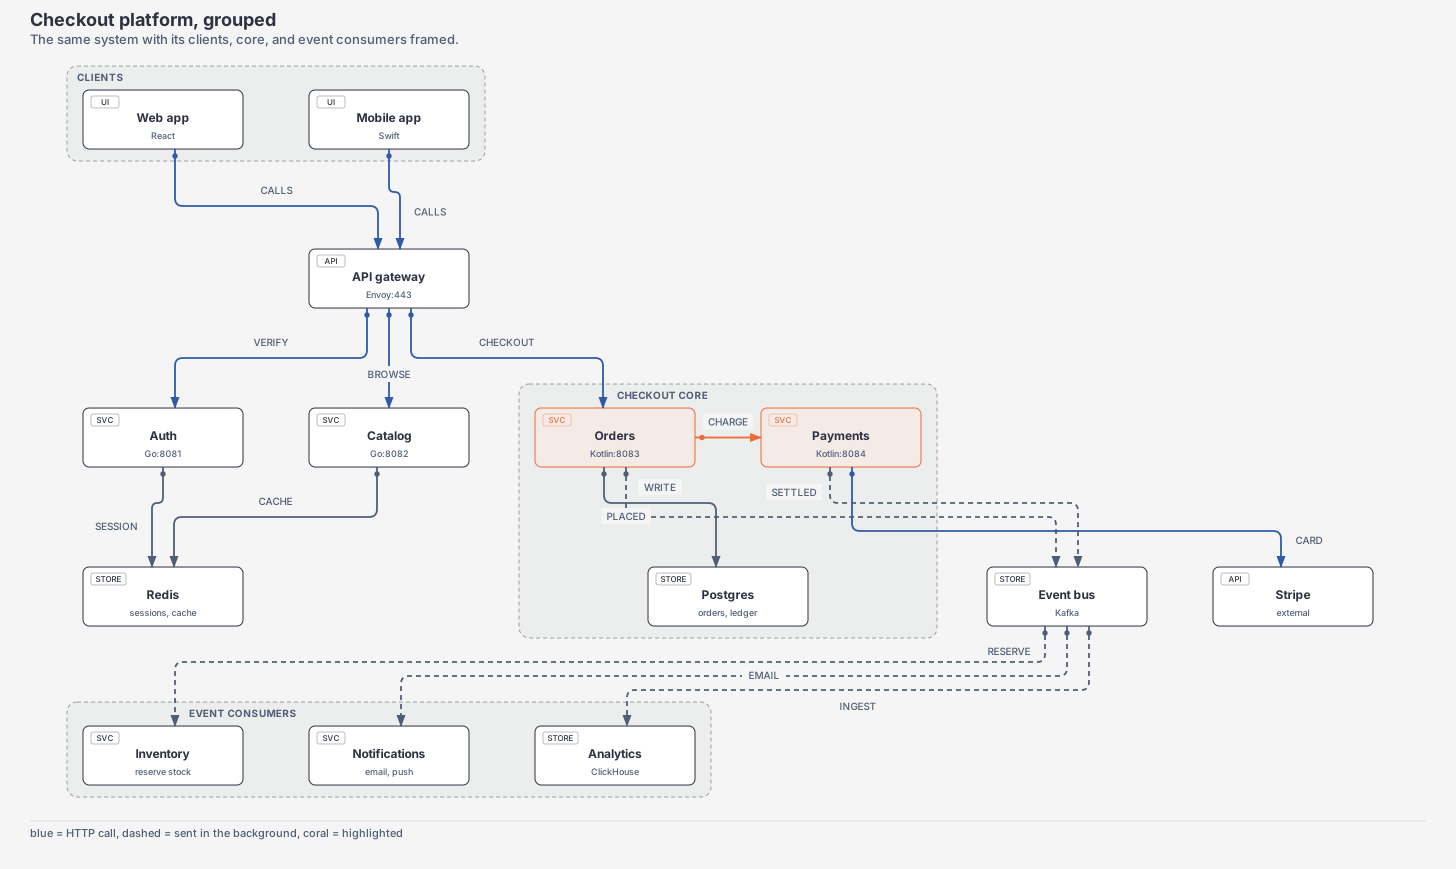
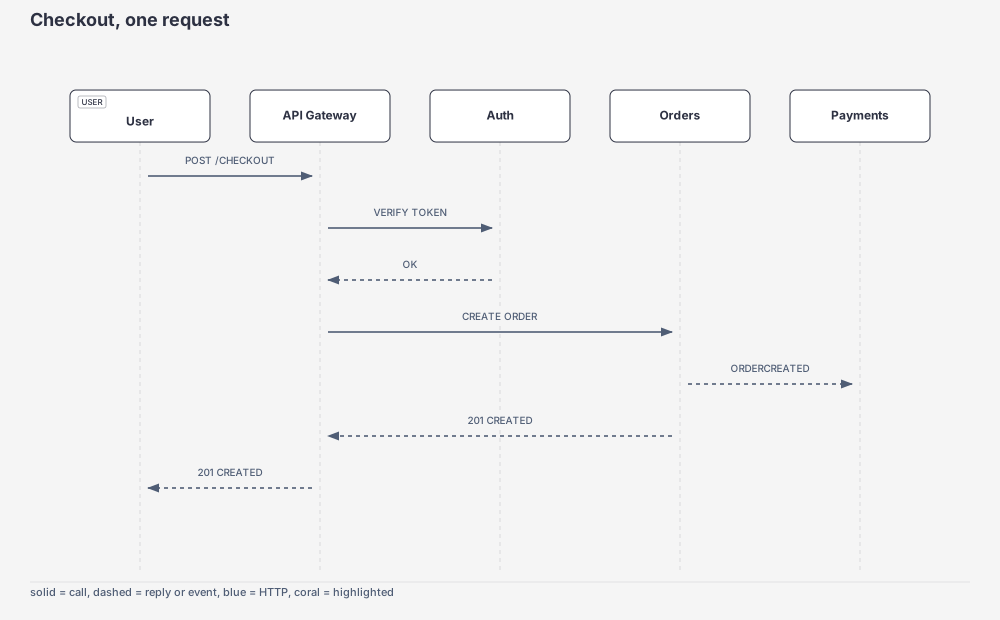
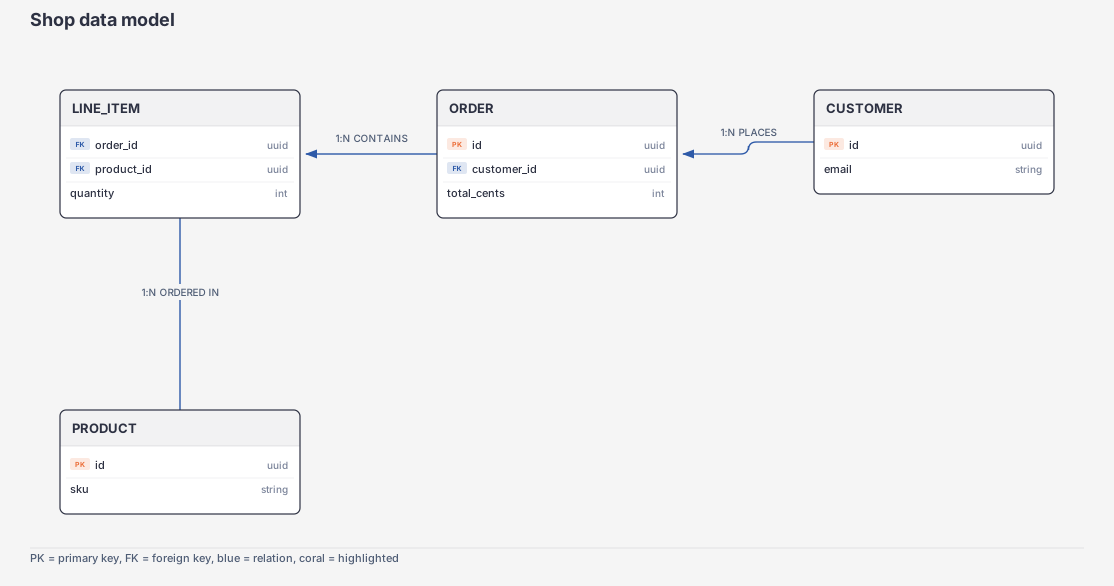
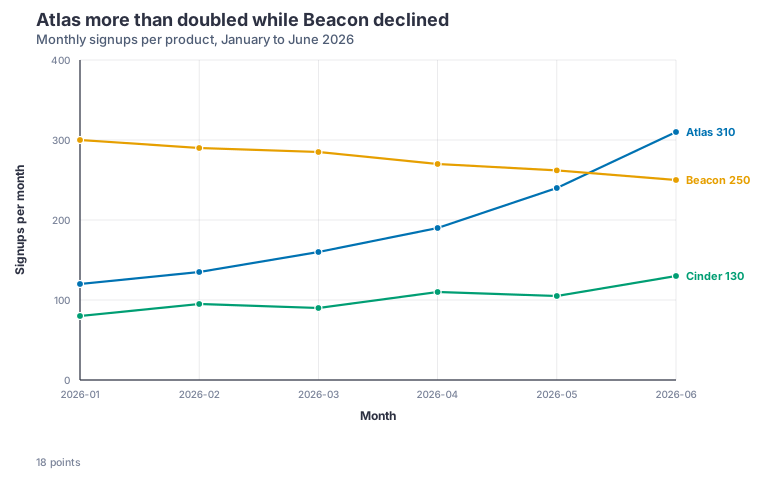
Every figure was drawn from a file in [`examples/`](examples) and passed its own audit. Rebuild them with `py -3 scripts/build_site.py`.
## Tests
```bash
py -3 tests_smoke.py
```
Exit 0 means every check passed.
## License
[MIT](LICENSE)
<!-- mcp-name: io.github.lucas19919/diagonaldiagrams -->
TDQS
Scored across 6 tools
Each tool has a distinct role: describe (spec shape), render (draw), validate (dry-run check), audit (SVG QA), export (format conversion), infer (CSV to spec). The main overlap is between validate and render (which internally validates) and between audit and render (which internally audits), but descriptions make the boundaries reasonably clear.
All six tools use a consistent single lowercase verb convention (describe, render, validate, audit, export, infer). No mixed casing, no noun_verb hybrids, no stylistic deviations.
Six tools is well-scoped for a diagram spec/render/export pipeline. Each tool covers a distinct stage (introspect, author, check, QA, convert, generate) and none feels redundant or bolted on.
The surface covers a full lifecycle: discover spec shape, infer from CSV, validate, render, audit, and export to multiple formats. Minor gaps like batch rendering or listing prior outputs exist, but core workflows have no dead ends.