
Chart-Output MCP Server
# Chart-Output MCP Server
[](LICENSE)
[](https://www.npmjs.com/package/@chartoutput/mcp)
Render charts as PNG, SVG, or WebP images directly from Claude, Cursor,
Windsurf, or any MCP-compatible AI agent.
Ask your AI: *"Generate a bar chart showing Q1–Q4 revenue"* — it calls
Chart-Output and returns the image inline.
## What it produces
Ask your AI agent to generate a chart. This is what comes back.
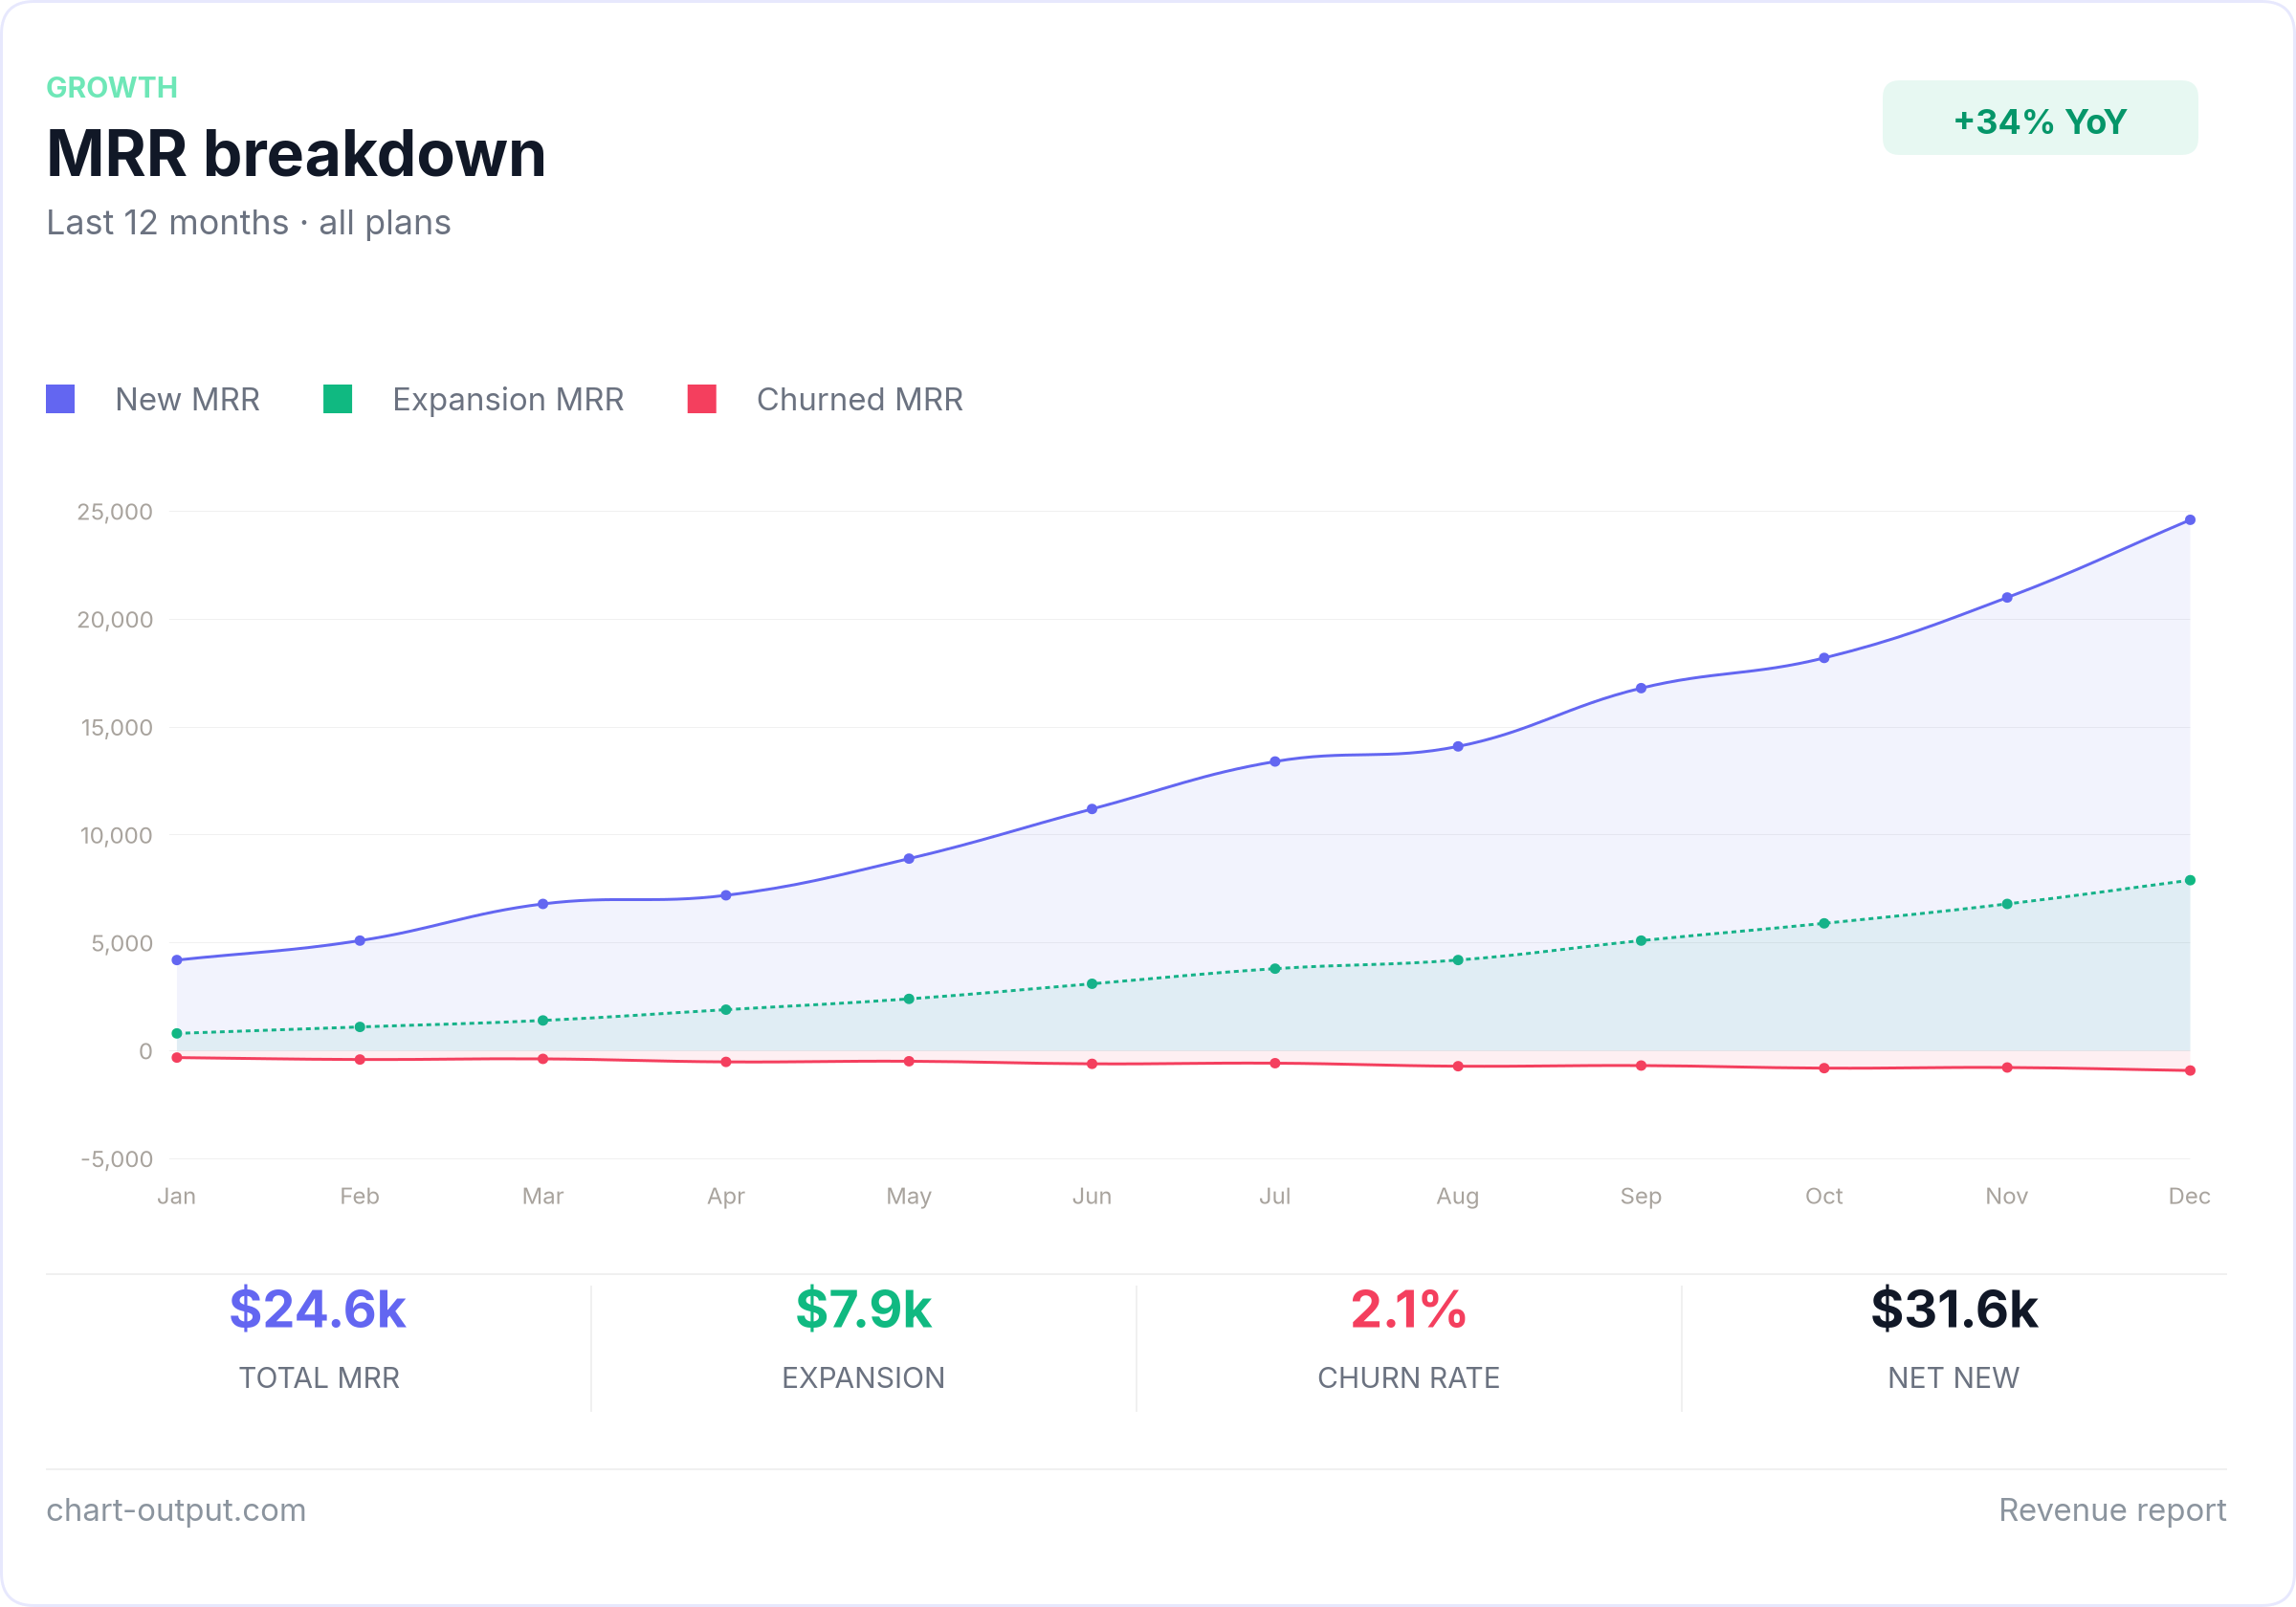
(If the image does not load in your viewer, open the [file on GitHub](https://github.com/jgaddy95/chart-output-mcp/blob/main/assets/mrr-breakdown.png).)
## Examples
Ready-to-use chart configs in [`/examples`](./examples).
Copy any file, swap in your data, POST to the API.
## Install
Add to your `mcp.json`:
```json
{
"mcpServers": {
"chart-output": {
"command": "npx",
"args": ["@chartoutput/mcp"],
"env": {
"CHART_OUTPUT_API_KEY": "pk_test_YOUR_KEY"
}
}
}
}
```
Get a free API key at [chart-output.com](https://www.chart-output.com/auth/sign-up)
— no credit card required.
## Tools
| Tool | Description |
|------|-------------|
| `list_chart_output_examples` | Shipped example spec ids — use before hand-writing `render_card` JSON |
| `get_chart_example` | Return full `examples/<id>.json` text (valid API body shape) |
| `render_chart` | Chart.js-style labels/datasets → inline image (optional `extensions` for partial dashboard fields) |
| `render_chart_url` | Same as `render_chart` → CDN URL instead of bytes |
| `render_card` | **Full card composition** JSON → inline image (header, KPI strip, footer, theme, `backgroundColor`, etc.); spec is POSTed verbatim to `/api/v1/render` |
| `render_card_url` | Same full card composition as `render_card` → CDN URL instead of bytes |
| `render_chart_ai` | Natural language + data → image (Pro/Business key required) |
MCP **resources** also expose the same files as `application/json` at `chart-output://examples/<id>` (e.g. `mrr-breakdown`). Prefer `get_chart_example` or a resource read over guessing the schema.
## Example
Once installed, just ask your AI agent:
> "Create a line chart showing monthly active users growing from
> 12k in January to 28k in December"
The agent calls `render_chart`, `render_card`, or `render_chart_ai` and returns
the image directly in chat. No code required. Use **`render_card`** for branded dashboard layouts (dark theme, KPI row, footer), or **`render_card_url`** when you need an openable/shareable link.
## API Key
1. Sign up at [chart-output.com](https://www.chart-output.com/auth/sign-up)
2. Go to Dashboard → API Keys → Create key
3. Add it to your `mcp.json` as shown above
Free trial includes 500 renders. No credit card required.
## Glama
Registry listing and quality card:
[](https://glama.ai/mcp/servers/jgaddy95/chart-output-mcp)
## Links
- [Chart-Output docs](https://www.chart-output.com/docs)
- [npm package](https://www.npmjs.com/package/@chartoutput/mcp)
- [Chart-Output pricing](https://www.chart-output.com/pricing)
- [Glama MCP listing](https://glama.ai/mcp/servers/jgaddy95/chart-output-mcp)
- [License](LICENSE)TDQS
Scored across 3 tools
The three tools have clearly distinct purposes: render_chart for direct JSON specification rendering, render_chart_ai for AI-generated charts from natural language, and render_chart_url for URL-based output. However, render_chart and render_chart_url share the same input format, which could cause minor confusion about when to use each, though their different outputs (inline image vs. URL) help differentiate them.
All tool names follow a consistent verb_noun pattern with 'render_chart' as the base, extended with suffixes (_ai, _url) to indicate variations. This predictable naming makes it easy for an agent to understand the tool relationships and select the appropriate one based on the suffix.
With only 3 tools, this server is well-scoped for its purpose of chart rendering. Each tool serves a distinct use case (direct rendering, AI generation, URL output), and there are no extraneous tools. The count is appropriate for covering the core functionalities without being overwhelming or insufficient.
The tool set covers the main chart rendering workflows: direct specification, AI-assisted generation, and URL-based output. A minor gap is the lack of tools for chart editing, deletion, or management (e.g., updating or deleting rendered charts), but for a rendering-focused server, the provided tools are sufficient for most agent tasks.