A
licenseNot graded
qualityF
maintenanceAn MCP server that enables Large Language Models to retrieve, analyze, and query metric data from Prometheus databases through pre-defined routes.
33
MIT

Provides tools for monitoring and metrics collection through Prometheus, allowing for querying and visualization of time-series data.
Click on "Deploy Server".
Wait a few minutes for the server to deploy. Once ready, it will show a "Started" state.
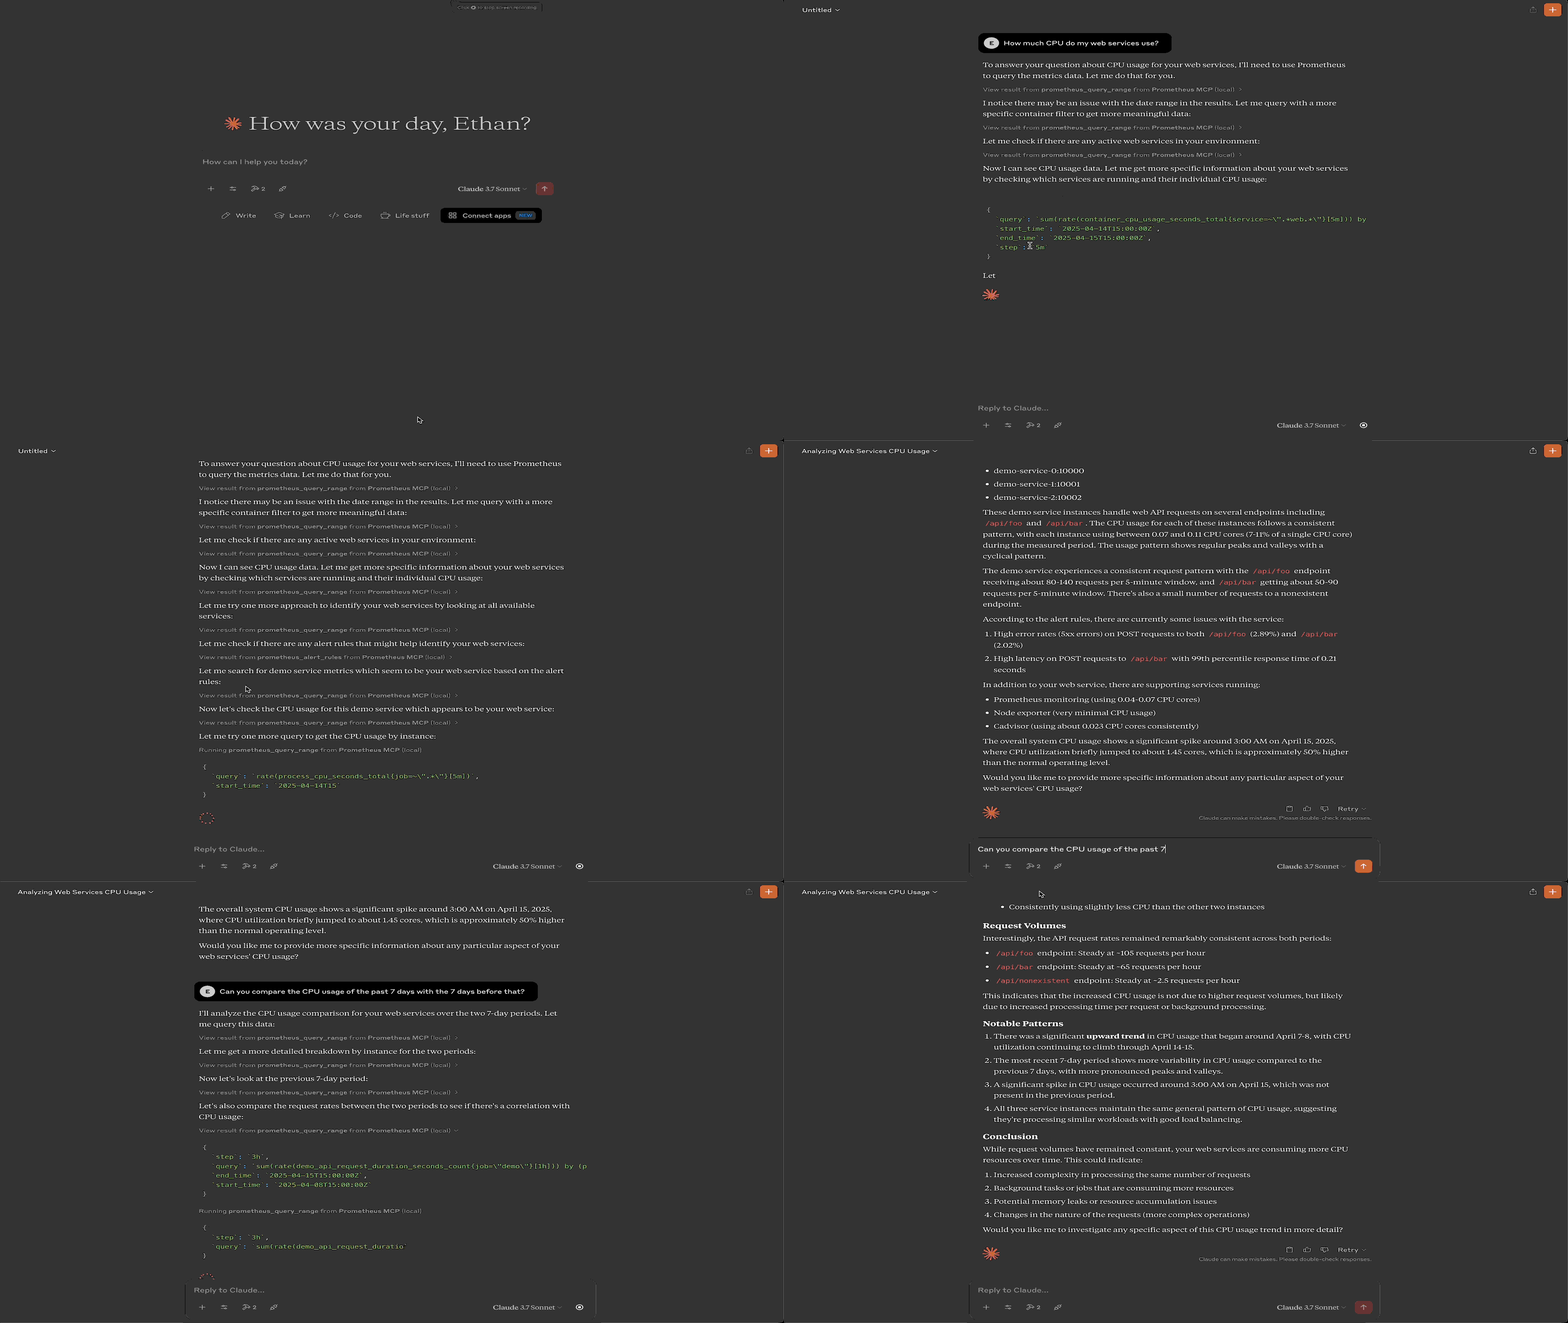
In the chat, type @ followed by the MCP server name and your instructions, e.g., "@Prometheus MCP show me the CPU usage for the last hour"
That's it! The server will respond to your query, and you can continue using it as needed.
Here is a step-by-step guide with screenshots.
Proof-of-concept Prometheus MCP server.
Install uv: https://docs.astral.sh/uv/getting-started/installation/
Using uv, you can also install python.
Related MCP server: Scenario Word
Clone this repo.
Update the .env file
uv add "mcp[cli]" pillow google-auth matplotlib requests python-dotenvYou can run the server with
uv --directory "/directory/to/prometheus-mcp" run server.pySo you may add this MCP server to your Claude MCP server configuration
{
  "mcpServers": {
      "Prometheus MCP": {
          "command": "/path/to/uv",
          "args": [
              "--directory",
              "/directory/to/prometheus-mcp",
              "run",
              "server.py"
          ]
      }
  }
}
See MCP Quickstart for more details for Claude specific instructions.
Query the Prometheus /rules API. Returns a list of alerting and recording rules that are currently loaded. In addition it returns the currently active alerts fired by the Prometheus instance of each alerting rule.
| Name | Required | Description | Default |
|---|---|---|---|
No parameters | |||
Does the description disclose side effects, auth requirements, rate limits, or destructive behavior?
No annotations are provided, so the description carries the full burden. It returns currently loaded rules and active alert, implying a read operation, but does not explicitly state read-only behavior or disclose permissions, rate limits, or side effects.
Agents need to know what a tool does to the world before calling it. Descriptions should go beyond structured annotations to explain consequences.
Is the description appropriately sized, front-loaded, and free of redundancy?
The description is three sentences with no extraneous information. The first sentence immediately states the API endpoint, and subsequent sentences clarify the return content. Efficient and well-structured.
Shorter descriptions cost fewer tokens and are easier for agents to parse. Every sentence should earn its place.
Given the tool's complexity, does the description cover enough for an agent to succeed on first attempt?
With no parameters and no output schema, the description adequately explains what the tool does (returns rules and active alerts). It lacks details on pagination or response structure, but for a simple list tool, it is fairly complete.
Complex tools with many parameters or behaviors need more documentation. Simple tools need less. This dimension scales expectations accordingly.
Does the description clarify parameter syntax, constraints, interactions, or defaults beyond what the schema provides?
There are no parameters, and schema coverage is 100%. The description adds no parameter info, which is acceptable given no parameters exist. Baseline for 0-param tools is 4.
Input schemas describe structure but not intent. Descriptions should explain non-obvious parameter relationships and valid value ranges.
Does the description clearly state what the tool does and how it differs from similar tools?
The description clearly states it queries the Prometheus /rules API and returns a list of alerting/recording rules and active alerts. The verb 'Query' and resource 'Prometheus /rules' are specific, but it doesn't explicitly differentiate from the sibling tool 'prometheus_query_range', though the functionality is distinct enough.
Agents choose between tools based on descriptions. A clear purpose with a specific verb and resource helps agents select the right tool.
Does the description explain when to use this tool, when not to, or what alternatives exist?
No guidance on when to use this tool versus alternatives (e.g., prometheus_query_range). No mention of prerequisites or limitations such as authentication requirements or data freshness.
Agents often have multiple tools that could apply. Explicit usage guidance like "use X instead of Y when Z" prevents misuse.
Query Prometheus /query_range API endpoint and return
an image of a plot of the time series monitoring data.
Use this tool whenever the user asks about the status
of their compute infrastructure.
| Name | Required | Description | Default |
|---|---|---|---|
| step | Yes | ||
| query | Yes | ||
| end_time | Yes | ||
| start_time | Yes |
Does the description disclose side effects, auth requirements, rate limits, or destructive behavior?
No annotations are provided, so the description carries the burden. It discloses that the tool returns an image, which is a key behavior. However, it omits details like whether the operation is read-only, rate limits, or required permissions.
Agents need to know what a tool does to the world before calling it. Descriptions should go beyond structured annotations to explain consequences.
Is the description appropriately sized, front-loaded, and free of redundancy?
Two sentences, front-loaded with core purpose, no redundancy. Every sentence adds value.
Shorter descriptions cost fewer tokens and are easier for agents to parse. Every sentence should earn its place.
Given the tool's complexity, does the description cover enough for an agent to succeed on first attempt?
Given the complexity (4 required params, no schema descriptions, no output schema), the description is too sparse. It does not clarify parameter format, return image type, error handling, or how the tool integrates with the sibling.
Complex tools with many parameters or behaviors need more documentation. Simple tools need less. This dimension scales expectations accordingly.
Does the description clarify parameter syntax, constraints, interactions, or defaults beyond what the schema provides?
Schema coverage is 0%, and the description does not explain any of the four required parameters (query, start_time, end_time, step). Even though 0 parameters have descriptions, the description fails to compensate, offering no semantic guidance.
Input schemas describe structure but not intent. Descriptions should explain non-obvious parameter relationships and valid value ranges.
Does the description clearly state what the tool does and how it differs from similar tools?
The description clearly states the tool queries the Prometheus /query_range API and returns an image plot. It explicitly distinguishes itself from the sibling prometheus_alert_rules by focusing on time series data and plots.
Agents choose between tools based on descriptions. A clear purpose with a specific verb and resource helps agents select the right tool.
Does the description explain when to use this tool, when not to, or what alternatives exist?
The description provides a clear usage context: 'Use this tool whenever the user asks about the status of their compute infrastructure.' While it doesn't explicitly exclude alternatives, it gives direct guidance on when to use it.
Agents often have multiple tools that could apply. Explicit usage guidance like "use X instead of Y when Z" prevents misuse.
Recent tool additions, removals, and schema changes observed during successful MCP inspections.
v1.0.0prometheus_alert_rulesprometheus_query_rangeScored across 2 tools
The two tools target completely different aspects: one retrieves alert and recording rules, the other queries time series data and returns a plot. There is no overlap in functionality, making selection unambiguous.
Both tools share the 'prometheus_' prefix and follow snake_case. One uses a noun phrase ('alert_rules') and the other a verb-noun phrase ('query_range'), which is a minor inconsistency but still predictable and descriptive.
With only 2 tools for a complex system like Prometheus, the server is severely under-scoped. Many essential operations (e.g., listing metrics, instant queries, target discovery) are missing, limiting its usefulness.
The server covers only alert rules and range queries with plots, leaving out critical Prometheus capabilities such as instant queries, metric metadata, targets, or alert management beyond listing rules. Agents cannot perform basic monitoring workflows.
A comprehensive Model Context Protocol (MCP) server that enables AI assistants to interact with yo…
MCP server unifying ERPs, CRMs, APIs and knowledge base for Claude, ChatGPT and Gemini.
MCP server for AI agents to plan, verify, and deploy Cloudflare-native apps.
MCP server for building and testing AI agents with multi-model experimentation and insights.