F
licenseC
qualityD
maintenanceA Model Context Protocol server that enables execution of JMeter performance tests through AI assistants and MCP-compatible clients like Claude, Cursor, and Windsurf.
2
-

Enables execution and analysis of Apache JMeter tests, providing tools to run JMX files, calculate performance metrics from JTL results, identify bottlenecks, and generate visual reports and recommendations.
Click on "Deploy Server".
Wait a few minutes for the server to deploy. Once ready, it will show a "Started" state.
In the chat, type @ followed by the MCP server name and your instructions, e.g., "@JMeter MCP Server run load_test.jmx and identify any performance bottlenecks"
That's it! The server will respond to your query, and you can continue using it as needed.
Here is a step-by-step guide with screenshots.
This is a Model Context Protocol (MCP) server that allows executing JMeter tests through MCP-compatible clients and analyzing test results.
📢 Looking for an AI Assistant inside JMeter? 🚀 Check outFeather Wand
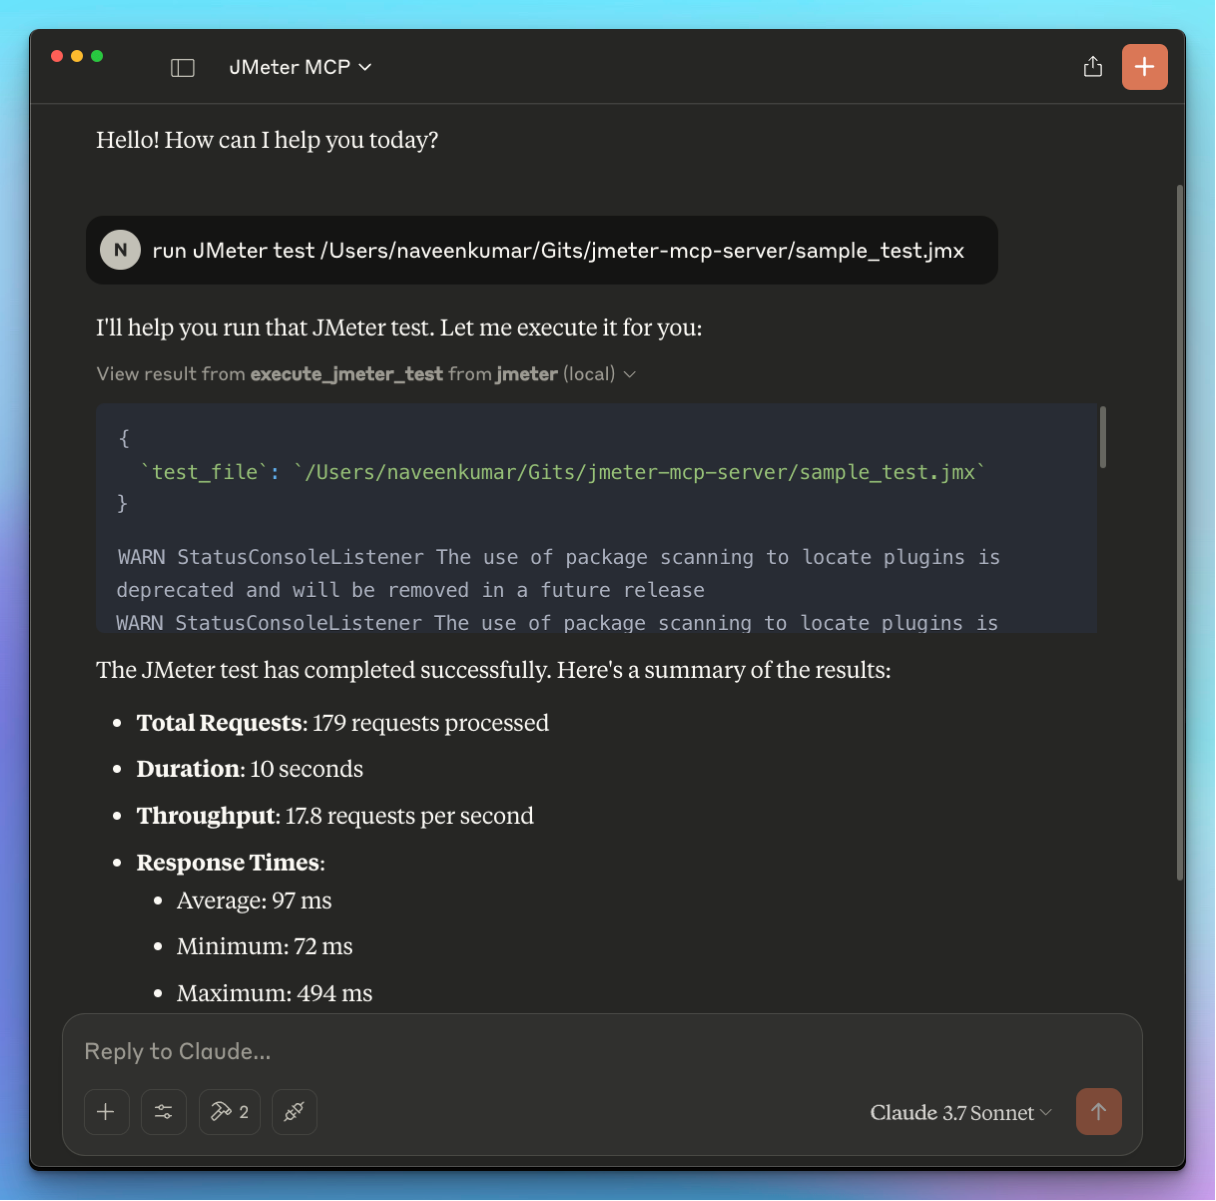
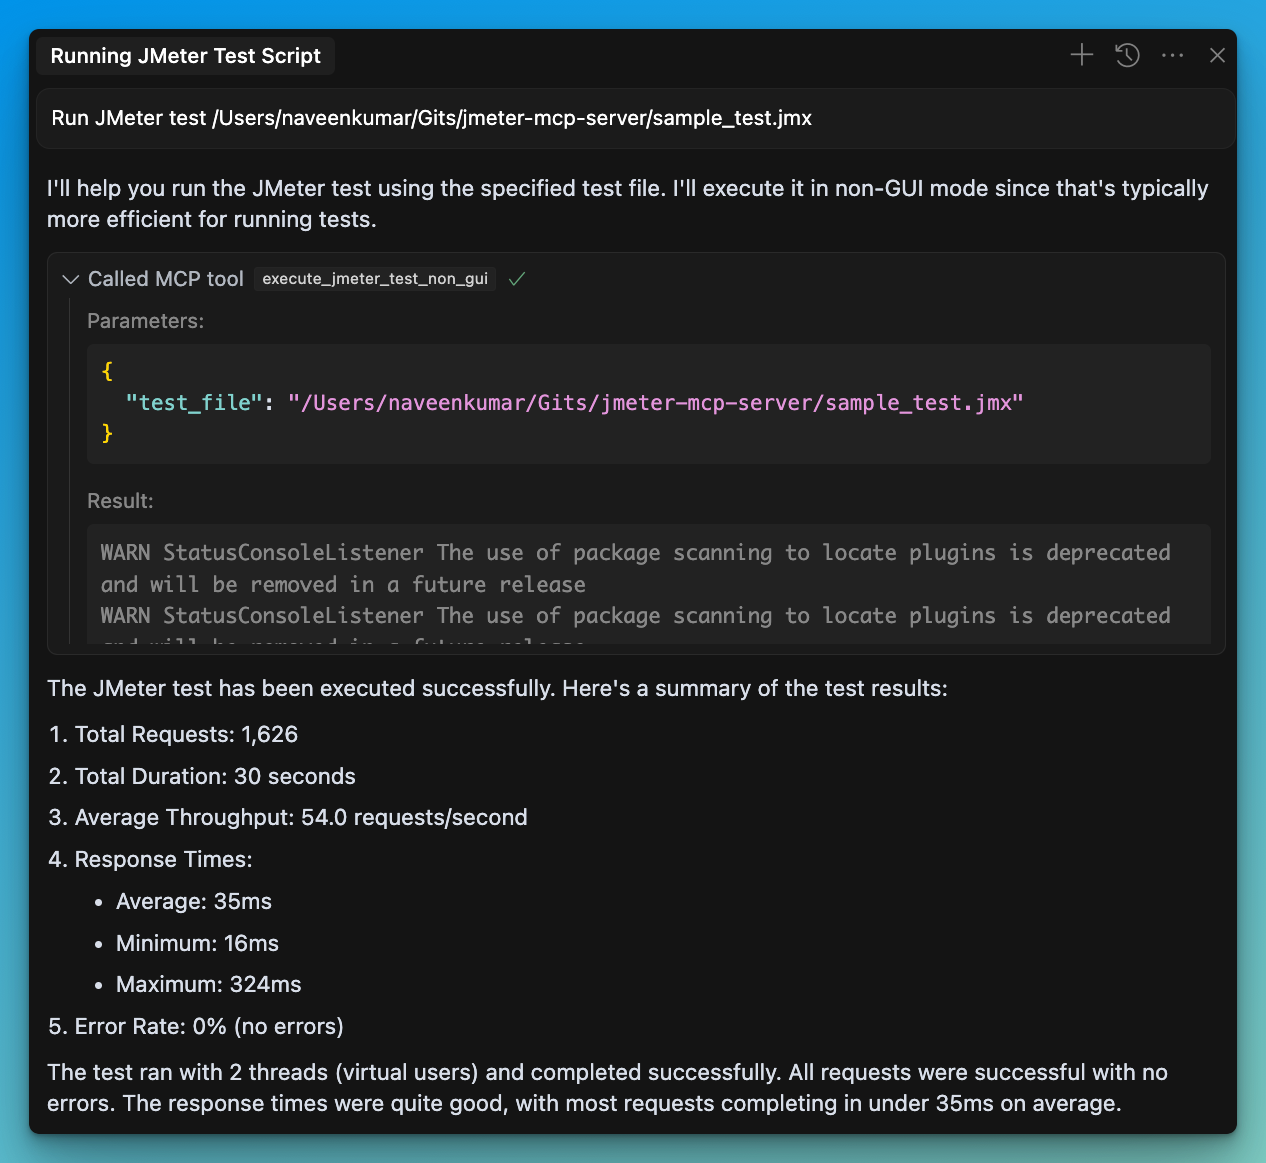
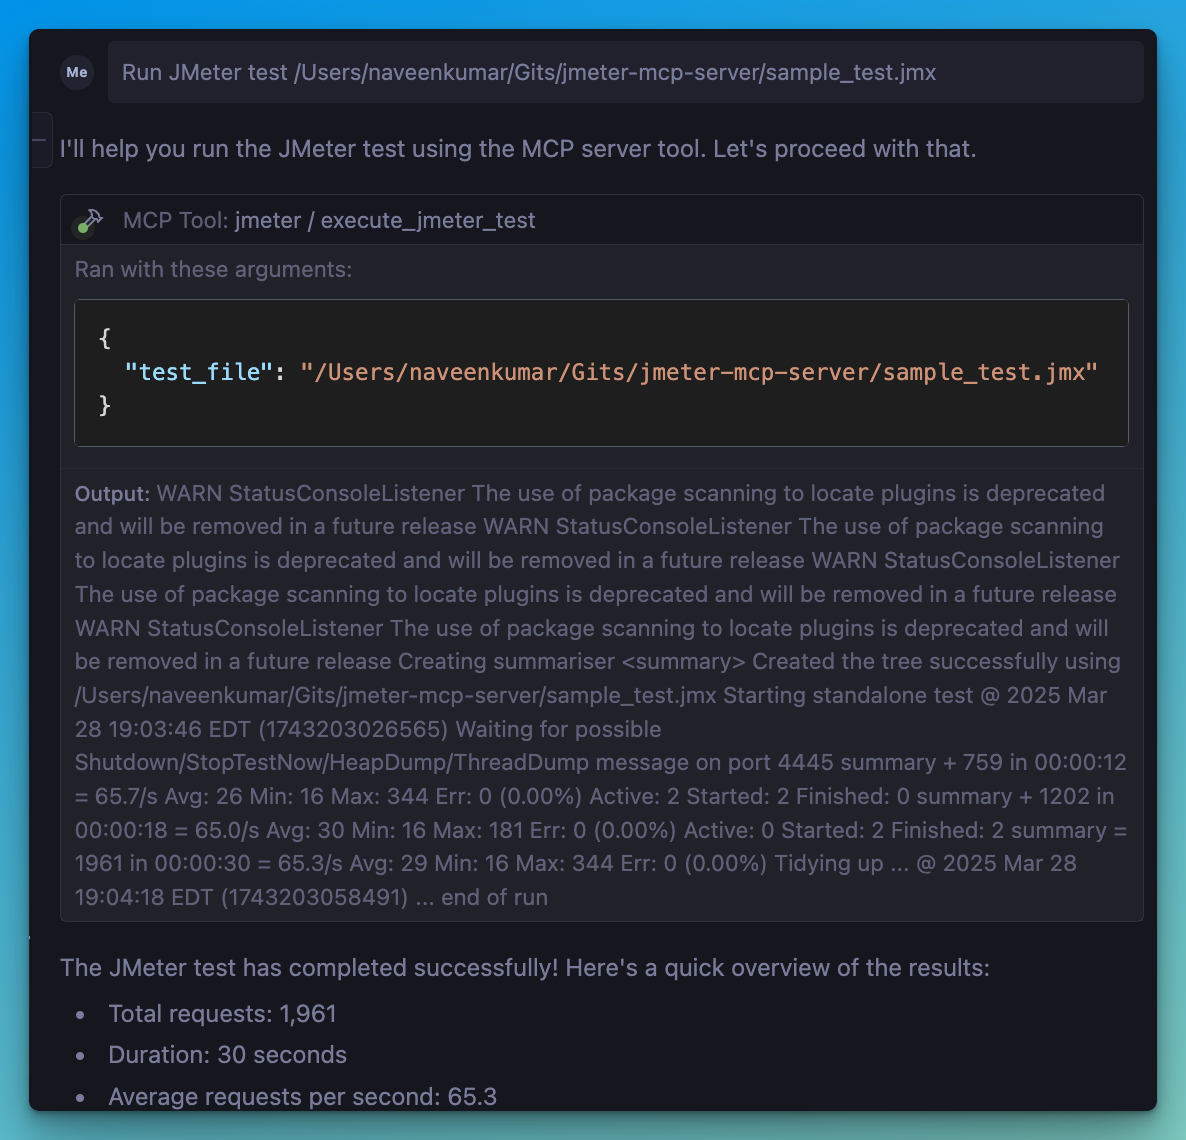
📊 Execute JMeter tests in non-GUI mode
🖥️ Launch JMeter in GUI mode
📝 Capture and return execution output
📊 Generate JMeter report dashboard
📈 Parse and analyze JMeter test results (JTL files)
📊 Calculate comprehensive performance metrics
🔍 Identify performance bottlenecks automatically
💡 Generate actionable insights and recommendations
📊 Create visualizations of test results
📑 Generate HTML reports with analysis results
Related MCP server: BlazeMeter MCP Server
Install uv:
Ensure JMeter is installed on your system and accessible via the command line.
⚠️ Important: Make sure JMeter is executable. You can do this by running:
chmod +x /path/to/jmeter/bin/jmeterInstall dependencies and run the server:
uv syncConfigure the .env file, refer to the .env.example file for details.
# JMeter Configuration
JMETER_HOME=/path/to/apache-jmeter-5.6.3
JMETER_BIN=${JMETER_HOME}/bin/jmeter

# Optional: JMeter Java options
JMETER_JAVA_OPTS="-Xms1g -Xmx2g"Connect to the server using an MCP-compatible client (e.g., Claude Desktop, Cursor, Windsurf)
Send a prompt to the server:
Run JMeter test /path/to/test.jmxMCP compatible client will use the available tools:
🖥️ execute_jmeter_test: Launches JMeter in GUI mode, but doesn't execute test as per the JMeter design
🚀 execute_jmeter_test_non_gui: Execute a JMeter test in non-GUI mode (default mode for better performance)
📊 analyze_jmeter_results: Analyze JMeter test results and provide a summary of key metrics and insights
🔍 identify_performance_bottlenecks: Identify performance bottlenecks in JMeter test results
💡 get_performance_insights: Get insights and recommendations for improving performance
📈 generate_visualization: Generate visualizations of JMeter test results
Add the following configuration to your MCP client config:
{
    "mcpServers": {
      "jmeter": {
        "command": "uv",
        "args": [
          "--directory",
          "/path/to/jmeter-mcp-server",
          "run",
          "jmeter_server.py"
        ]
      }
    }
}Run JMeter tests in non-GUI mode for better performance
Launch JMeter in GUI mode for test development
Generate JMeter report dashboards
Analyze JTL files to understand performance characteristics
Identify performance bottlenecks and their severity
Get actionable recommendations for performance improvements
Generate visualizations for better understanding of results
Create comprehensive HTML reports for sharing with stakeholders
The server will:
Validate that the test file exists
Check that the file has a .jmx extension
Validate that JTL files exist and have valid formats
Capture and return any execution or analysis errors
The Test Results Analyzer is a powerful feature that helps you understand your JMeter test results better. It consists of several components:
Supports both XML and CSV JTL formats
Efficiently processes large files with streaming parsers
Validates file formats and handles errors gracefully
Calculates overall performance metrics (average, median, percentiles)
Provides endpoint-specific metrics for detailed analysis
Generates time series metrics to track performance over time
Compares metrics with benchmarks for context
Identifies slow endpoints based on response times
Detects error-prone endpoints with high error rates
Finds response time anomalies and outliers
Analyzes the impact of concurrency on performance
Provides specific recommendations for addressing bottlenecks
Analyzes error patterns and suggests solutions
Generates insights on scaling behavior and capacity limits
Prioritizes recommendations based on potential impact
Creates time series graphs showing performance over time
Generates distribution graphs for response time analysis
Produces endpoint comparison charts for identifying issues
Creates comprehensive HTML reports with all analysis results
# Run a JMeter test and generate a results file
Run JMeter test sample_test.jmx in non-GUI mode and save results to results.jtl

# Analyze the results
Analyze the JMeter test results in results.jtl and provide detailed insights

# Identify bottlenecks
What are the performance bottlenecks in the results.jtl file?

# Get recommendations
What recommendations do you have for improving performance based on results.jtl?

# Generate visualizations
Create a time series graph of response times from results.jtlAnalyze JMeter test results and provide a summary of key metrics and insights.
Args: jtl_file: Path to the JTL file containing test results detailed: Whether to include detailed analysis (default: False)
Returns: str: Analysis results in a formatted string
Inputs: jtl_file (required), detailed. Returns: result
Execute a JMeter test.
Args: test_file: Path to the JMeter test file (.jmx) gui_mode: Whether to run in GUI mode (default: False) properties: Dictionary of JMeter properties to pass with -J (default: None)
Inputs: test_file (required), gui_mode, properties. Returns: result
Execute a JMeter test in non-GUI mode - supports JMeter properties.
Args: test_file: Path to the JMeter test file (.jmx) properties: Dictionary of JMeter properties to pass with -J (default: None) generate_report: Whether to generate report dashboard after load test (default: False) report_output_dir: Output folder for report dashboard (default: None) log_file: Name of JTL file to log sample results to (default: None)
Inputs: test_file (required), properties, generate_report, report_output_dir, +1 more. Returns: result
Generate visualizations of JMeter test results.
Args: jtl_file: Path to the JTL file containing test results visualization_type: Type of visualization to generate (time_series, distribution, comparison, html_report) output_file: Path to save the visualization
Returns: str: Path to the generated visualization file
Inputs: jtl_file (required), visualization_type (required), output_file (required). Returns: result
Get insights and recommendations for improving performance based on JMeter test results.
Args: jtl_file: Path to the JTL file containing test results
Returns: str: Performance insights and recommendations in a formatted string
Inputs: jtl_file (required). Returns: result
Identify performance bottlenecks in JMeter test results.
Args: jtl_file: Path to the JTL file containing test results
Returns: str: Bottleneck analysis results in a formatted string
Inputs: jtl_file (required). Returns: result
Recent tool additions, removals, and schema changes observed during successful MCP inspections.
Loading tool schema changelog…
Scored across 6 tools
Most tools have distinct purposes: analyzing results, executing tests, generating visualizations, and identifying bottlenecks. However, 'analyze_jmeter_results' and 'get_performance_insights' could be confused as both provide analysis from test results, though one focuses on metrics and the other on recommendations.
All tool names follow a consistent snake_case pattern with clear verb_noun structures, such as 'execute_jmeter_test' and 'generate_visualization'. The naming is uniform and predictable across all six tools.
With 6 tools, the server is well-scoped for JMeter testing, covering execution, analysis, visualization, and bottleneck identification. Each tool serves a clear purpose without being overly sparse or bloated.
The tool set covers key aspects of JMeter testing: execution (with GUI and non-GUI options), result analysis, visualization, and bottleneck insights. A minor gap is the lack of tools for test creation or editing, but core workflows are well-supported.
Free test management over MCP: projects, test cases, plans, runs, environments and tasks.
MCP observability: analyse MCP server usage, investigate sessions, and instrument MCP servers.
Scans remote MCP servers for protocol, security, and TLS issues; exposes scan tools via MCP.
MEOK MCP Test MCP — golden-file + schema-drift + tool-failure tests for any MCP server. Drop-in