
Perfetto MCP
自然言語を強力なPerfettoトレース分析に変換
自然言語のプロンプトを、的を絞ったPerfetto分析に変換するModel Context Protocol (MCP) サーバーです。SQLを書くことなく、ジャンクの解説、ANRの診断、CPUホットスレッドの特定、ロック競合の発見、メモリリークの検出を迅速に行えます。
✨ 特徴
自然言語 → SQL: 平易な英語で質問するだけで、正確なPerfettoクエリを取得
ANR検出: Application Not Responding (ANR) イベントを自動的に特定・分析
パフォーマンス分析: CPUプロファイリング、フレームジャンク検出、メモリリーク検出
スレッド競合: 同期ボトルネックとロック競合の発見
Binderプロファイリング: IPCパフォーマンスと低速なシステムインタラクションの分析
Related MCP server: etw-mcp
📋 前提条件
🚀 はじめに

または ~/.cursor/mcp.json (グローバル) か .cursor/mcp.json (プロジェクト) に追加してください:
{
  "mcpServers": {
    "perfetto-mcp": {
      "command": "uvx",
      "args": ["perfetto-mcp"]
    }
  }
}
以下のコマンドを実行してください。詳細は Claude Code MCP docs を参照してください。
# Add to user scope
claude mcp add perfetto-mcp --scope user -- uvx perfetto-mcp
または ~/claude.json (macOS) か %APPDATA%\Claude\claude.json (Windows) を編集してください:
{
  "mcpServers": {
    "perfetto-mcp": {
      "command": "uvx",
      "args": ["perfetto-mcp"]
    }
  }
}
または .vscode/mcp.json (プロジェクト) に追加するか、「MCP: Add Server」コマンドを実行してください:
{
  "mcpServers": {
    "perfetto-mcp": {
      "command": "uvx",
      "args": ["perfetto-mcp"]
    }
  }
}
GitHub Copilot ChatのAgentモードで有効にしてください。
~/.codex/config.toml を編集してください:
[mcp_servers.perfetto-mcp]
command = "uvx"
args = ["perfetto-mcp"]
オプション: ローカルの trace_processor_shell バイナリを使用する
ネットワーク環境でダウンロードがブロックされる場合は、PERFETTO_MCP_TRACE_PROCESSOR_BIN_PATH にローカルの trace_processor_shell バイナリへの絶対パスを設定してください。
この環境変数が設定されている場合、perfetto-mcp はそのバイナリを直接使用します。
設定されていない場合、デフォルトの perfetto Pythonの動作が適用されます。
例 (mcp.json):
{
  "mcpServers": {
    "perfetto-mcp": {
      "command": "uvx",
      "args": ["perfetto-mcp"],
      "env": {
        "PERFETTO_MCP_TRACE_PROCESSOR_BIN_PATH": "D:/tools/perfetto/trace_processor_shell.exe"
      }
    }
  }
}
例 (~/.codex/config.toml):
[mcp_servers.perfetto-mcp]
command = "uvx"
args = ["perfetto-mcp"]
[mcp_servers.perfetto-mcp.env]
PERFETTO_MCP_TRACE_PROCESSOR_BIN_PATH = "D:/tools/perfetto/trace_processor_shell.exe"
ローカルインストール (開発サーバー)
cd perfetto-mcp-server
uv sync
uv run mcp dev src/perfetto_mcp/dev.py
{
  "mcpServers": {
    "perfetto-mcp-local": {
      "command": "uv",
      "args": [
        "--directory",
        "/path/to/git/repo/perfetto-mcp",
        "run",
        "-m",
        "perfetto_mcp"
      ],
      "env": { "PYTHONPATH": "src" }
    }
  }
}
pip3 install perfetto-mcp
python3 -m perfetto_mcp
📖 使用方法
開始プロンプトの例:
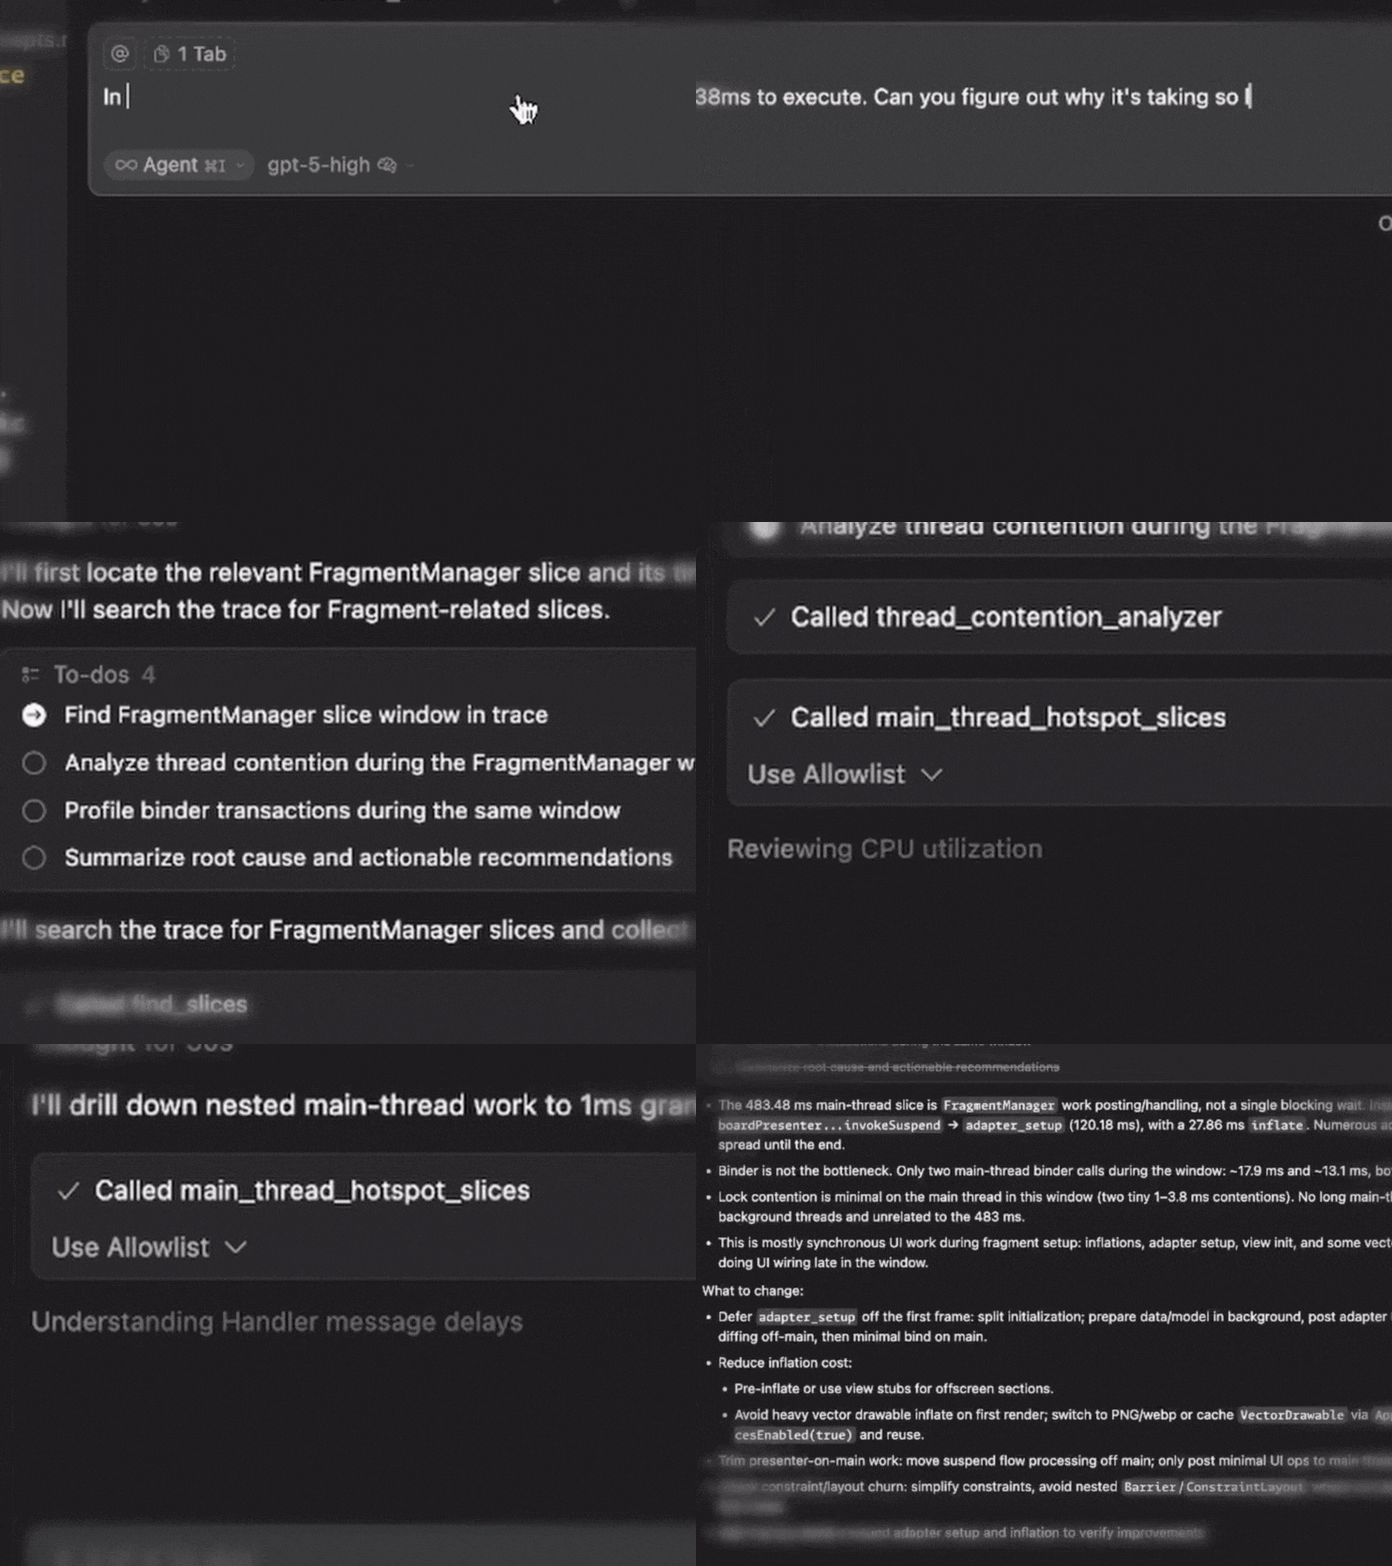
Perfettoトレースで、FragmentManagerの実行に438msかかっていることがわかります。なぜこれほど時間がかかっているのか調査できますか?
必須パラメータ
すべてのツールで以下の2つの入力が必要です:
パラメータ | 説明 | 例 |
trace_path | Perfettoトレースへの絶対パス | /path/to/trace.perfetto-trace
|
process_name | 対象のプロセス/アプリ名 | com.example.app
|
プロンプトでの指定方法
トレースとプロセスを明示し、プロンプトの先頭に以下のように記述してください:
"Use perfetto trace /absolute/path/to/trace.perfetto-trace for process com.example.app"
オプションのフィルタ
多くのツールは追加のフィルタリングをサポートしています (LLMに任せてください):
time_range: {start_ms: 10000, end_ms: 25000}
ツール固有のしきい値: min_block_ms, jank_threshold_ms, limit
🛠️ 利用可能なツール
🔎 探索と発見
ツール | 目的 | プロンプト例 |
find_slices
| スライス名を調査し、ホットパスを特定 | "Find slice names containing 'Choreographer' and show top examples" |
execute_sql_query
| 高度な分析のためにカスタムPerfettoSQLを実行 | "Run custom SQL to correlate threads and frames in the first 30s" |
🚨 ANR分析
注: 記録されたトレースにANRが含まれている場合に有効です
ツール | 目的 | プロンプト例 |
detect_anrs
| 重大度分類付きでANRイベントを検出 | "Detect ANRs in the first 10s and summarize severity" |
anr_root_cause_analyzer
| 可能性の高い順にANR原因を深掘り分析 | "Analyze ANR root cause around 20,000 ms and rank likely causes" |
🎯 パフォーマンスプロファイリング
ツール | 目的 | プロンプト例 |
cpu_utilization_profiler
| スレッドレベルのCPU使用率とスケジューリング | "Profile CPU usage by thread and flag the hottest threads" |
main_thread_hotspot_slices
| メインスレッドで最も長く実行されている操作を特定 | "List main-thread hotspots >50 ms during 10s–25s" |
📱 UIパフォーマンス
ツール | 目的 | プロンプト例 |
detect_jank_frames
| 期限を逃したフレームを特定 | "Find janky frames above 16.67 ms and list the worst 20" |
frame_performance_summary
| フレーム全体の健全性メトリクス | "Summarize frame performance and report jank rate and P99 CPU time" |
🔒 同時実行とIPC
ツール | 目的 | プロンプト例 |
thread_contention_analyzer
| 同期ボトルネックの発見 | "Find lock contention between 15s–30s and show worst waits" |
binder_transaction_profiler
| Binder IPCパフォーマンスの分析 | "Profile slow Binder transactions and group by server process" |
💾 メモリ分析
ツール | 目的 | プロンプト例 |
memory_leak_detector
| 持続的なメモリ増加パターンの発見 | "Detect memory-leak signals over the last 60s" |
heap_dominator_tree_analyzer
| メモリを大量消費するクラスの特定 | "Analyze heap dominator classes and list top offenders" |
出力形式
すべてのツールは以下の構造化されたJSONを返します:
📚 リソース
📄 ライセンス
Apache 2.0 License。詳細は LICENSE を参照してください。


