
graphview
# graphview-mcp
**See what your agent knows, and how it finds it.**
<!-- The GIF lives on the `media` branch so that main stays light. -->
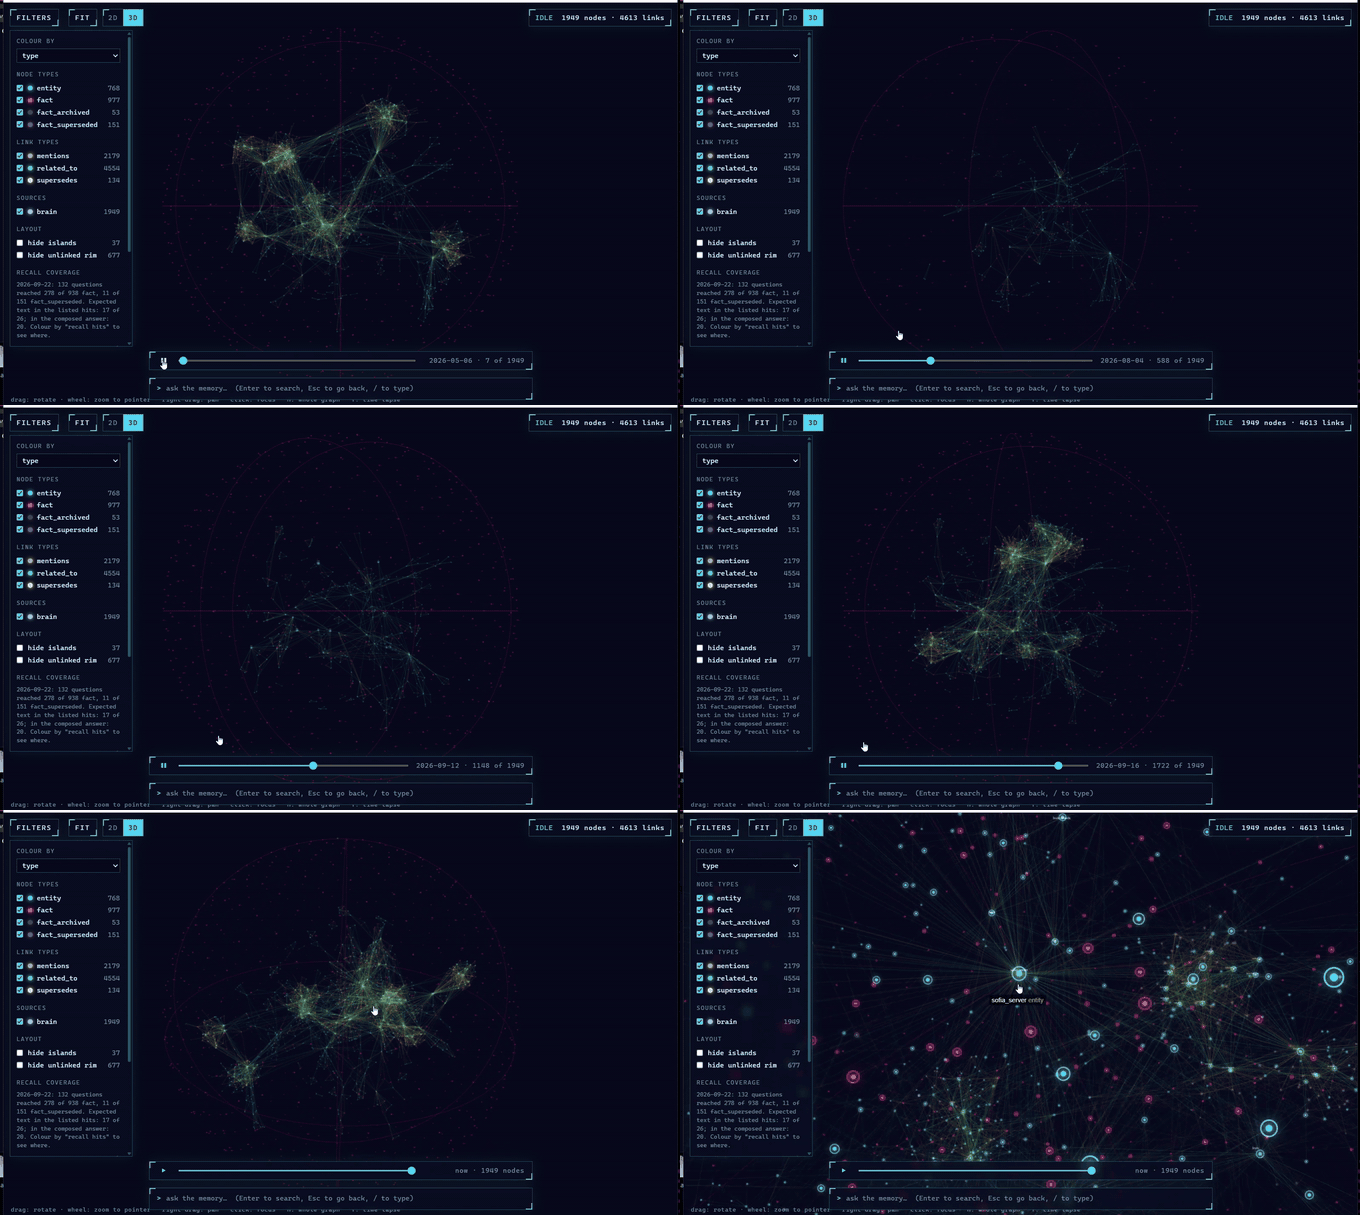
*A real memory: 1,949 nodes distilled from four months of an assistant's work, played back in time, then opened up.*
An agent's memory is a graph nobody has ever looked at whole: facts, entities,
versions, the episodes they came from. This is a read-only viewer and MCP
server for that graph. It shows the memory as a full-screen graph you can
rotate, flatten, search and replay in time; it puts a box in front of the
memory's own recall so you can ask it a question and watch which facts light
up; and it measures what the recall can and cannot reach.
It reads an Obsidian vault, the `memory.json` of the Knowledge Graph Memory MCP,
or any SQLite database you describe in a few lines of YAML. It never writes to
any of them.
Status: 0.1, used daily on one real memory. Working name.
## What it is for
- **Debugging recall.** Ask the question your assistant got wrong. See which
facts the recall returned, where they sit, what they link to, and whether the
right fact exists but was not reached. Run a whole benchmark through it and
colour the graph by how often each fact came back: what stays dark is memory
no question ever reaches.
- **Reading a memory's health.** Facts nobody linked to anything form a rim
around the graph. Small groups cut off from the rest are islands. Names that
differ by a letter are probably the same thing twice. One export gives you the
checklist, and the next export tells you what moved.
- **Trust.** Click a fact and see the versions it replaced and the episodes it
was distilled from. "Why does the assistant believe this?" has an answer.
It is built on one small canonical model (nodes with `id, label, type, source,
props, created_at`, typed edges), so a memory you have never seen can be
mapped in an afternoon.
## Try it in two minutes
```bash
git clone https://github.com/adecubed/graphview-mcp && cd graphview-mcp
uv run graphview serve examples/vault
```
The browser opens on a fictional lab's notes. Drag to rotate, scroll to zoom,
click a node, type a question. Then the same lab **as an agent would remember
it**: episodes distilled into facts, facts that supersede earlier versions,
facts nobody linked, confidence that decays. Two SQLite files, a YAML, and a
stand-in recall in sixty lines:
```bash
uv run python examples/memory/recall_server.py # in another terminal
uv run graphview serve --config examples/memory/graphview.yaml
```
Ask it *which port does north signal run on*. The recall answers, its facts
light up, and clicking one shows the versions it replaced and the episodes it
came from. Everything in `examples/` is invented (`make_vault.py` and
`make_memory.py` regenerate it).
`graphview serve memory.json` works the same way for a Memory MCP file. Your own
SQLite memory needs a mapping: see [Configuration](#configuration).
### As an app, not a browser tab
```bash
uv run --extra app graphview app
```
opens graphview in a window of its own, through the system's web view
(WebView2 on Windows, WebKit on macOS and Linux), with no memory given a panel
asks which one to open: a notes folder, a `memory.json`, or a `graphview.yaml`.
The choice is remembered in `~/.graphview`, so the next `graphview app` opens
straight on it; `--choose` asks again. Installed as a package it is
`uvx "graphview-mcp[app]" app`.
## The viewer
| Do this | To |
|---|---|
| drag | rotate (3D) or pan (2D) |
| wheel | zoom towards the pointer; zooming out recentres |
| right-drag | pan |
| click a node | fly to it: text, properties, links, provenance |
| type, Enter | ask; matches light up, the rest fades |
| `Esc` / **back** | one step back |
| `H` / **fit** | drop any selection, show the whole graph |
| **2D / 3D** | flat map or free space; the choice is remembered |
| `T` / ▶ | time-lapse: watch the memory grow by creation date |
| **colour by** | type, source, recall hits, or any measure the nodes carry (confidence, last used, degree…) |
| **path from here…** | in a node's panel: pick another node, the shortest chain lights up |
| **export list** | the worklist as a Markdown checklist (see below) |
| `/` | focus the question box |
Nodes with no links at all do not drift around: they form the **rim**, a ring
in 2D and a shell in 3D, in the colour of what they are. What a memory holds
but has not tied to anything marks where the graph ends. Small disconnected
groups are counted as **islands**. Both can be hidden from the filters panel.
URL options: `?dim=2`, `?bloom=1` (extra glow, heavier), `?labels=0` (no node
names on the graph or on hover, for recording a real memory; panels still show
text when opened), `?debug=1` (exposes `window.__graphview`).
## Asking the memory
Without a recall, the box is a forgiving text search: `atlas server` finds
`atlas_server`, accents and word order do not matter.
With a `search:` block in the mapping, the box talks to **your memory's own
recall**, whatever it is (vector search, BM25, an LLM-composed answer):
```yaml
search:
url: http://127.0.0.1:9000/ask
method: POST
body: {query: "{query}"} # or params: for a query string
results: data.items # where the list sits in the reply
id: "fact:{key}" # node id built from each result
text: content # shown as the snippet
answer: summary # optional: a written answer, shown above the hits
timeout: 30
```
The written answer is shown, the hits are listed with their text, and the graph
lights up those nodes and what they link to. A hit the graph does not hold is
still listed, marked as not in the graph. If the endpoint is down, text search
answers and the status bar says so.
### Recall coverage
How much of the memory can the recall reach? Run a batch of questions through
it:
```bash
graphview coverage --config graphview.yaml --questions cases.json --probe entity
```
Questions come from files (`.json`, `.jsonl`, or text, one per line; objects
with `question` and optionally `expected`) and from probes: `--probe TYPE` asks
one question per node of that type, made of its name, best connected first
(`--probe-limit`, default 300). The pass counts how often each node came back,
per kind of node the search returns, and the viewer then offers **recall hits**
under *colour by*. What no question ever reaches stays dark; if that part has a
shape (one period, the rim, one kind of fact) you have a diagnosis a benchmark
score does not give.
When a question says what it expects, as benchmark cases do
(`"expected": [["8766"], ["harbour", "port"]]`: every group, any alternative,
whole tokens), the pass records where the text came back: in the listed hits
(✓), only in the answer composed around them (◐), or nowhere (✗). That tells a
retrieval miss from a generation miss. The filters panel lists the questions,
worst first; click one to run it and see what came back instead.
The report is saved as `~/.graphview/coverage-<hash>.json`. It holds the
questions and node ids, so treat it like the memory it describes.
## What's in here
A person opening a graph does not ask for node types; they ask what is in there.
A mapping can answer in the memory's own words with a `groups:` query: named
sets of nodes, each with a kind (`thing`, `folder`, `phrase`, `category` or
anything else) and its member ids as a JSON list:
```yaml
groups:
query: SELECT kind, name, field, members FROM groups ORDER BY id
```
The viewer lists them in a panel on the right, "what's in here": *Flats (31)*,
*Buyers (7)*, the folders documents came from, the phrases that recur in file
names, the categories with their values. Click one and its members light up;
click again and the whole graph comes back. Agents get the same list from the
`groups` tool. A top-level `names:` map gives plain names to what the data
calls by a column (`names: {key: Flats, ACQUIRENTE: Buyers}`).
## Reading a memory's health
**Export list**, at the bottom of the filters, saves a Markdown checklist of
what probably wants fixing at the source:
- likely duplicates: same-type nodes whose names differ by separators, case,
accents or a letter or two;
- very connected nodes: linked to a large share of the graph. A real hub, or a
generic word that got extracted as an entity and now adds noise to every
search;
- islands, and unlinked nodes with their text.
The viewer changes nothing; this is the list you take to whatever does. Each
export adds a line of counts to a history, so the next one opens with a trend
table and what moved since last time: the way to tell whether the memory is
getting better. The same lists are a tool (`worklist`) for the agent.
## Provenance
A prop can hold ids of rows kept elsewhere, such as the episodes a fact was
distilled from. Declare which prop refers to which lookup, and the query that
resolves one id:
```yaml
nodes:
- query: SELECT 'fact:' || key AS id, key, content, source_episodes FROM sem.facts
id: id
label: key
type: fact
props: [content, source_episodes] # a JSON list in the column becomes a list
refs: {source_episodes: episode}
lookups:
episode:
query: SELECT task_id AS id, created_at, summary FROM epi.episodes WHERE task_id = ?
```
The node panel then shows "source episodes: 26 episodes · show" and resolves
them on click. The `provenance` tool gives an agent the same rows together with
the chain of what the node superseded and what superseded it: any edge type
called `supersedes`, which a `query:` edge can build with `json_each` when the
column holds a JSON list of keys. `examples/memory/graphview.yaml` does all of
this.
When the same list of three or more references sits on other nodes, the panel
says so ("listed on 6 other nodes: a batch, not this node's own sources") and
`refs` carries `shared_with`. A distiller that stamps every fact it writes with
the whole batch it was reading leaves exactly that trace; it is the first thing
this view showed us about ours. Two nodes sharing a single reference are just
two nodes that came from the same place, so they pass without comment.
## Configuration
Write a `graphview.yaml` and pass it with `--config`. Several sources load into
one view, each with its own colour under *colour by: source*.
```yaml
sources:
- name: notes
adapter: wikilinks
path: ~/vault
- name: memory
adapter: sqlite
path: /data/graph.db
attach: # other databases, joined read-only under an alias
sem: /data/semantic.db
nodes:
- table: entities # or query: "SELECT ..."
id: id
label: name
type: {column: kind} # or a fixed string: type: person
created_at: created_at # feeds the time-lapse
props: [email, notes]
- query: SELECT 'fact:' || key AS id, key, content FROM sem.facts
id: id
label: key
type: fact
props: [content] # content / text / description show as the node's text
edges:
- table: links
from: from_id
to: to_id
type: {column: link_type}
props: [weight]
masking: false # true hides emails, phone and card numbers, IBANs, US SSNs
limit: 5000 # nodes sent to the viewer; above it the best-connected are kept
colors:
person: "#ffd166"
```
When two tables have overlapping ids, give one an `id_prefix: doc` and use
`from_prefix` / `to_prefix` on the edges that point at it. In a vault, `type:`
in a note's frontmatter sets its node type and `created:` or `date:` its date;
without them the type is `note` and the date is the file's.
## As an MCP server
```json
{
"mcpServers": {
"graphview": {
"command": "uv",
"args": ["run", "--directory", "/path/to/graphview-mcp", "graphview", "mcp", "--config", "/path/to/graphview.yaml"]
}
}
}
```
Tools: `get_graph`, `get_node`, `neighbors`, `search`, `path`, `provenance`,
`worklist`, `graph_stats`, `list_types`, `reload`, `open_viewer(focus?, query?)`.
Answers are sized for an agent's context, not for a screen: parallel links
merge into one with a `count`, neighbours come as id, label and type, and both
nodes and links are capped, with the real totals in `meta`. The viewer gets the
full data. `open_viewer` opens the browser on this machine, focused on a node or
on a question, so "show me what you know about X" becomes a picture.
## Safety
- The sources are never written to. SQLite, attached databases included, is
opened with `mode=ro` and `query_only`; a missing file is an error, not a new
database. The one place graphview writes is its own folder,
`~/.graphview` (or `GRAPHVIEW_HOME`): the worklist history, a date and a few
counts per export with the sources identified by a hash, and the coverage
report when you run one.
- The viewer's server listens on `127.0.0.1` only, checks the `Host` header, and
needs a random token on every API call. The token travels in the URL
fragment, which browsers do not send or log. A port already in use is an
error, not a silent shadow.
- The `search:` URL comes from your config file and nothing else; the graph and
the page cannot change it.
- With masking on (`masking: true`, or `--mask` for one run) everything served,
search included, comes from a masked copy, and the source's own search is not
called, so a query cannot be used to probe for a hidden value. The default
patterns are regexes and **will not catch names**: check before you share a
screenshot. `mask_patterns:` replaces the defaults.
## Adapters
An adapter is a class with a `name` and `load() -> Graph`, one file under
`src/graphview/adapters/`; the wikilinks one is eighty lines. Everything else,
the tools, the viewer, the masking, the worklist, works on the canonical model.
See CONTRIBUTING.md.
## What would you add?
This was built against one real memory and two invented ones. If you run an
agent with a memory of its own, the most useful thing you can tell us is what
you could not see in it: open an issue with what your memory looks like and
what question you wanted the graph to answer.
Things we think are next, in no order:
- an open contract (`graph_schema` / `graph_query`) so any MCP server can make
itself viewable without an adapter: the proposal, and the questions we
cannot answer alone, are in `docs/graph-contract.md`;
- SQL auto-introspection (tables to node types, foreign keys to links), and
Postgres, DuckDB, Neo4j, GraphML, CSV;
- several memories in one view with a colour per origin (federation);
- everything the memory holds about one person, as an exportable list;
- topics found automatically and named after their hubs;
- an inline MCP Apps view next to the chat.
## Development
```bash
uv run pytest
cd viewer-src && npm ci && npm run build
```
The built viewer is committed under `src/graphview/viewer/`, so Python users do
not need Node; CI rebuilds it and fails if the bundle drifts from the source. It
is built on [3d-force-graph](https://github.com/vasturiano/3d-force-graph) and
Three.js; the full list of what the bundle contains is in
`src/graphview/viewer/THIRD_PARTY_NOTICES.txt`.
## Licence
Apache-2.0.
TDQS
Scored across 11 tools
Each tool has a clearly distinct purpose: opening the viewer, fetching subgraphs, getting single nodes, exploring neighbors, searching, statistics, pathfinding, provenance tracking, worklist analysis, type listing, and reloading. No overlap or ambiguity between tools.
Names are all lowercase and readable, but they mix verb-noun patterns (get_graph, list_types) with standalone nouns (neighbors, path, provenance, worklist). This inconsistency could cause an agent to hesitate on the expected action, though descriptions mitigate confusion.
11 tools is well-scoped for a graph viewer. Each tool covers a distinct aspect of graph exploration and maintenance without redundancy, and the count is neither sparse nor overwhelming.
The tool surface comprehensively covers the domain of graph viewing: browsing, searching, navigation, statistics, relationship tracing, provenance, and integrity checking. There are no obvious dead ends, and the missing CRUD operations are irrelevant since this is a read-only viewer.