
ChatBI MCP Server
Integrates with AntV charting library through mcp-server-chart to create interactive data visualizations and dashboards from analyzed data
Enables AI-powered data analysis and business intelligence capabilities using pandas DataFrames, including statistical analysis, data manipulation, and automated report generation
Click on "Install Server".
Wait a few minutes for the server to deploy. Once ready, it will show a "Started" state.
In the chat, type
@followed by the MCP server name and your instructions, e.g., "@ChatBI MCP Serveranalyze sales trends for the last quarter and create a summary report"
That's it! The server will respond to your query, and you can continue using it as needed.
Here is a step-by-step guide with screenshots.
ChatBI MCP Server
准备环境
配置LLM API Key
cp .env.example .env编辑.env文件,填写LLM信息,要生成代码,建议填写相对比较强的模型,比如GLM 4.5、Qwen-235B-A22B、Kimi K2等,至少Qwen3-32B,规模再小的生成代码质量会比较差,分析效果差。
安装依赖
uv venv .venv --python=3.11
source .venv/bin/activate
uv pip install -r requirements.txt
Related MCP server: SuperDataAnalysis - DataMaster_MCP
运行服务
cd src
python pandas_mcp_server.py
使用
配置ChatBI MCP Server
使用任意支持MCP Server的客户端,比如Cherry Studio,配置如下:
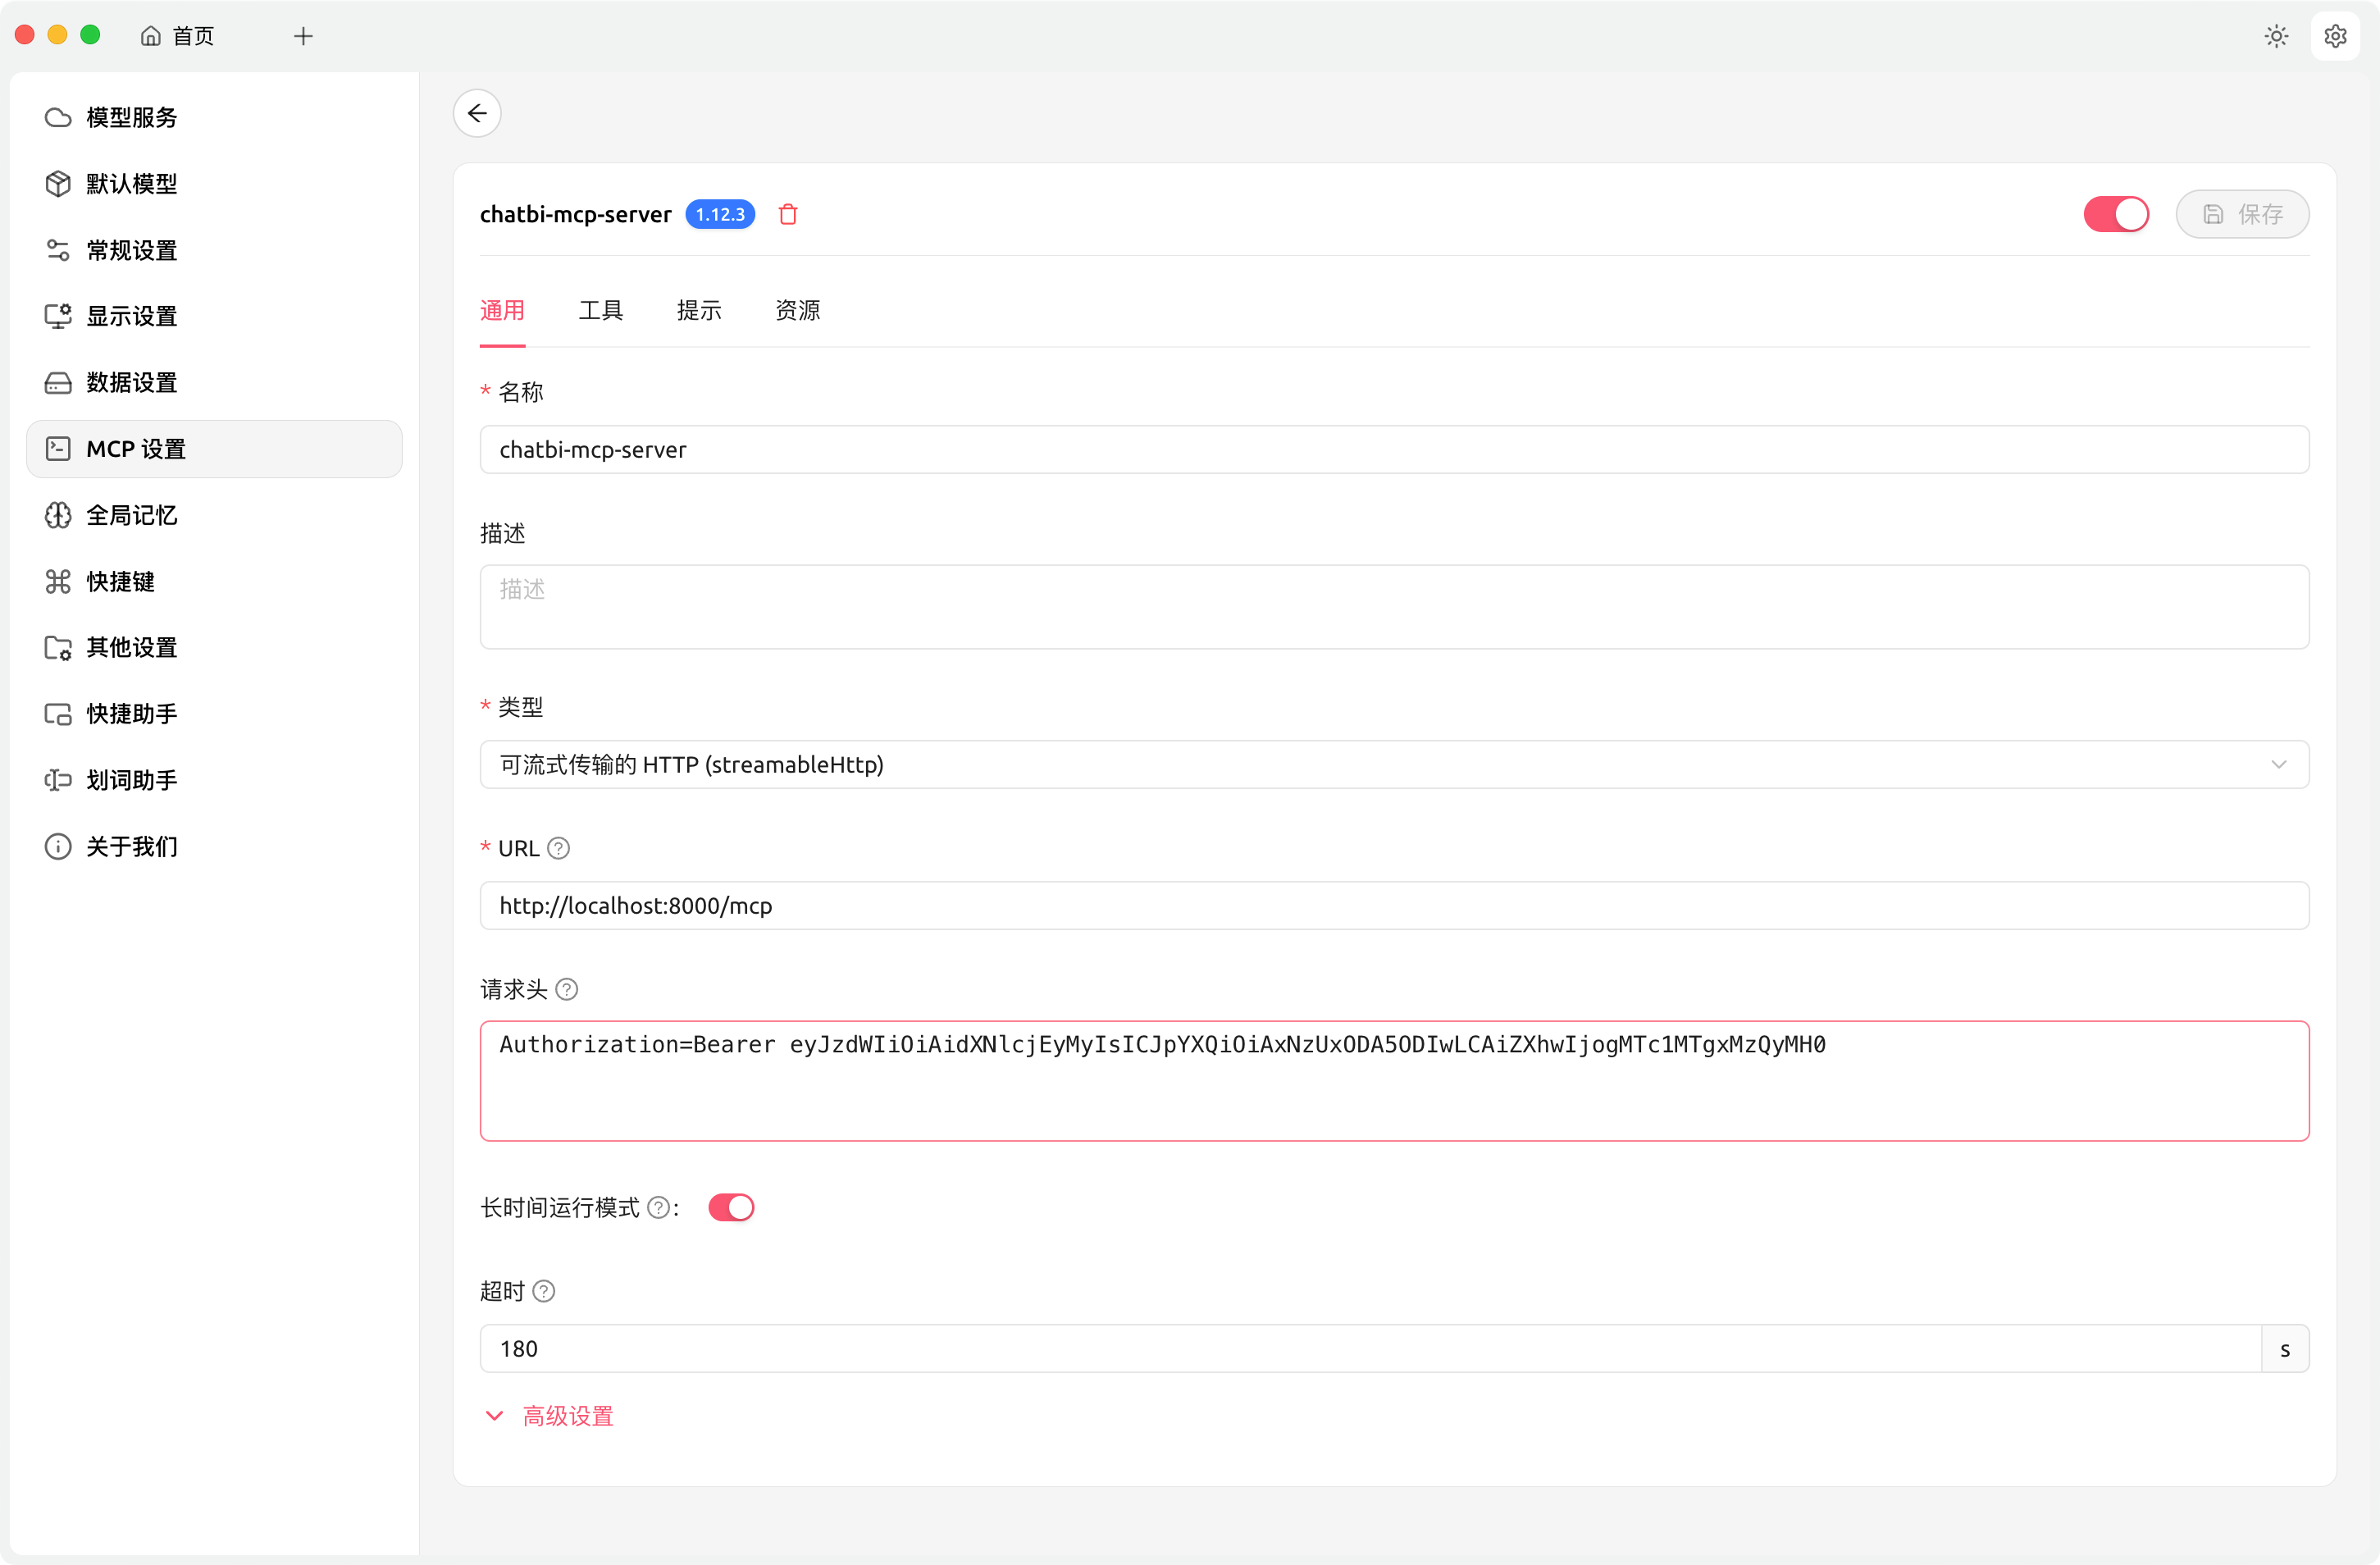
其中验证信息,在config.yaml中,可以自行修改。默认值为eyJzdWIiOiAidXNlcjEyMyIsICJpYXQiOiAxNzUxODA5ODIwLCAiZXhwIjogMTc1MTgxMzQyMH0。
注意:超时时间设置长一点,因为涉及LLM生成代码、如果出错还需要改错
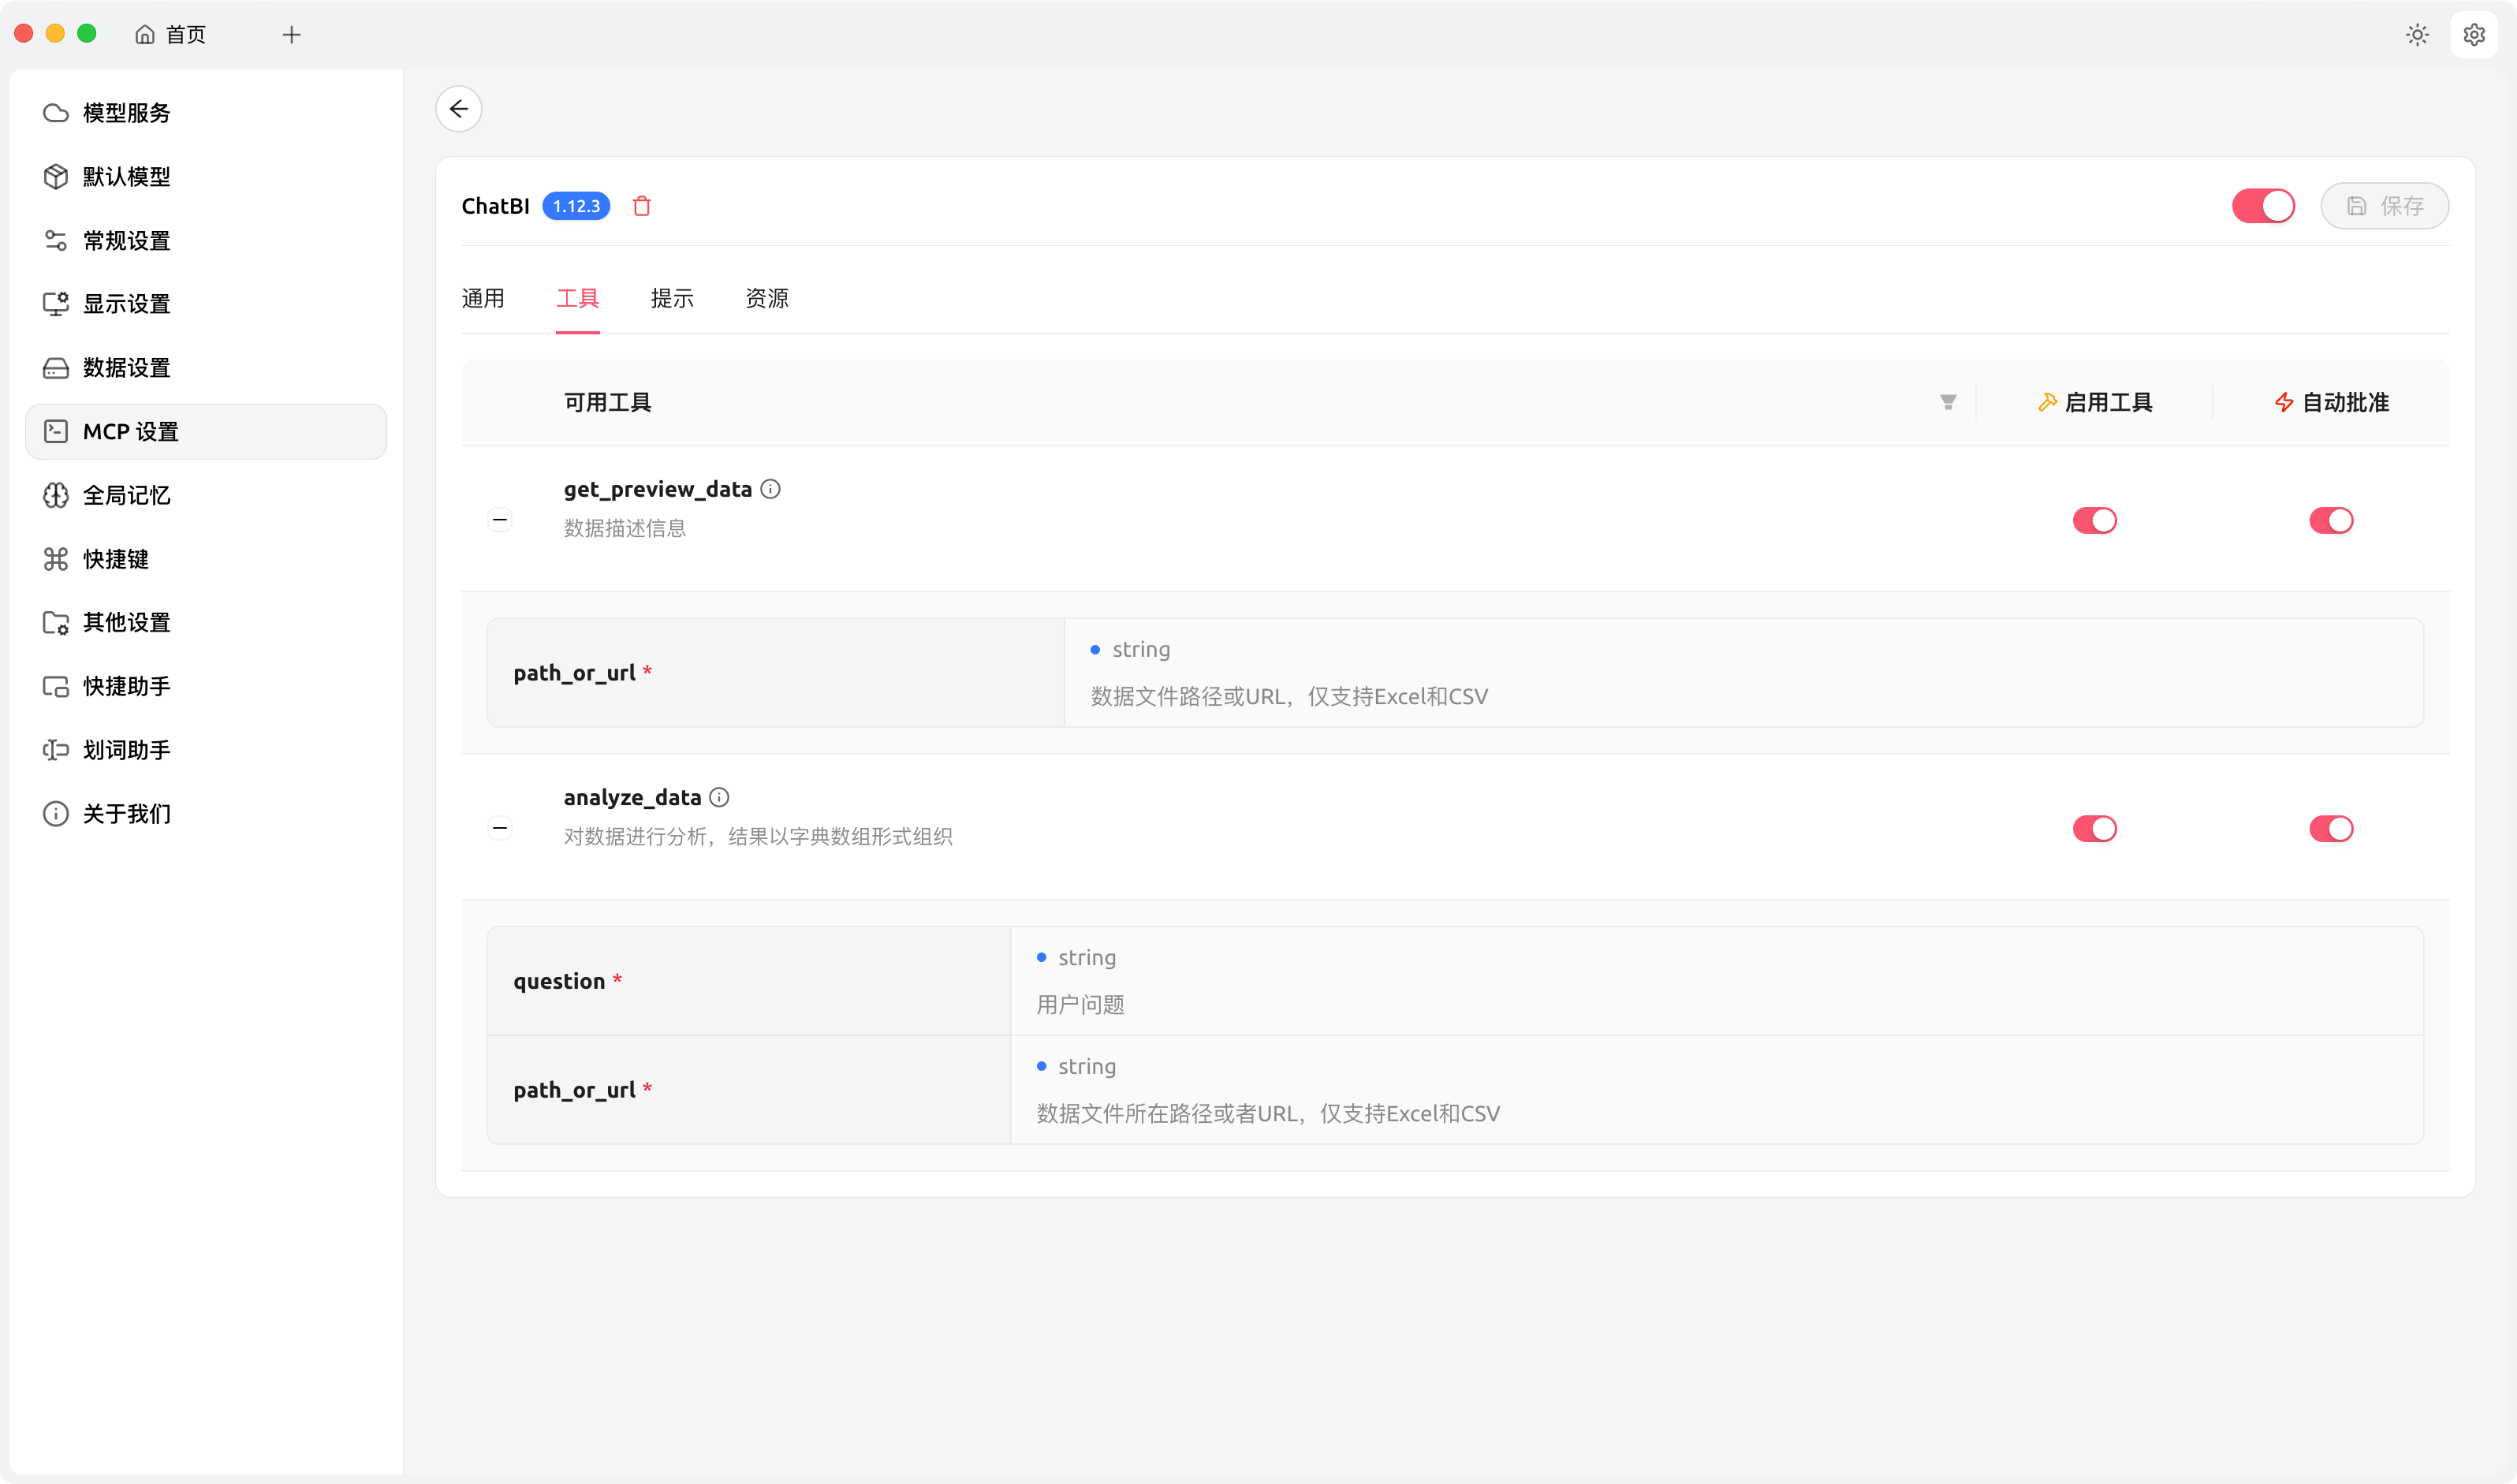
添加完成后,点击“保存”,然后点击又上方的开启选项,切换到“工具”标签页:
如果能正常列出工具,说明配置正确。
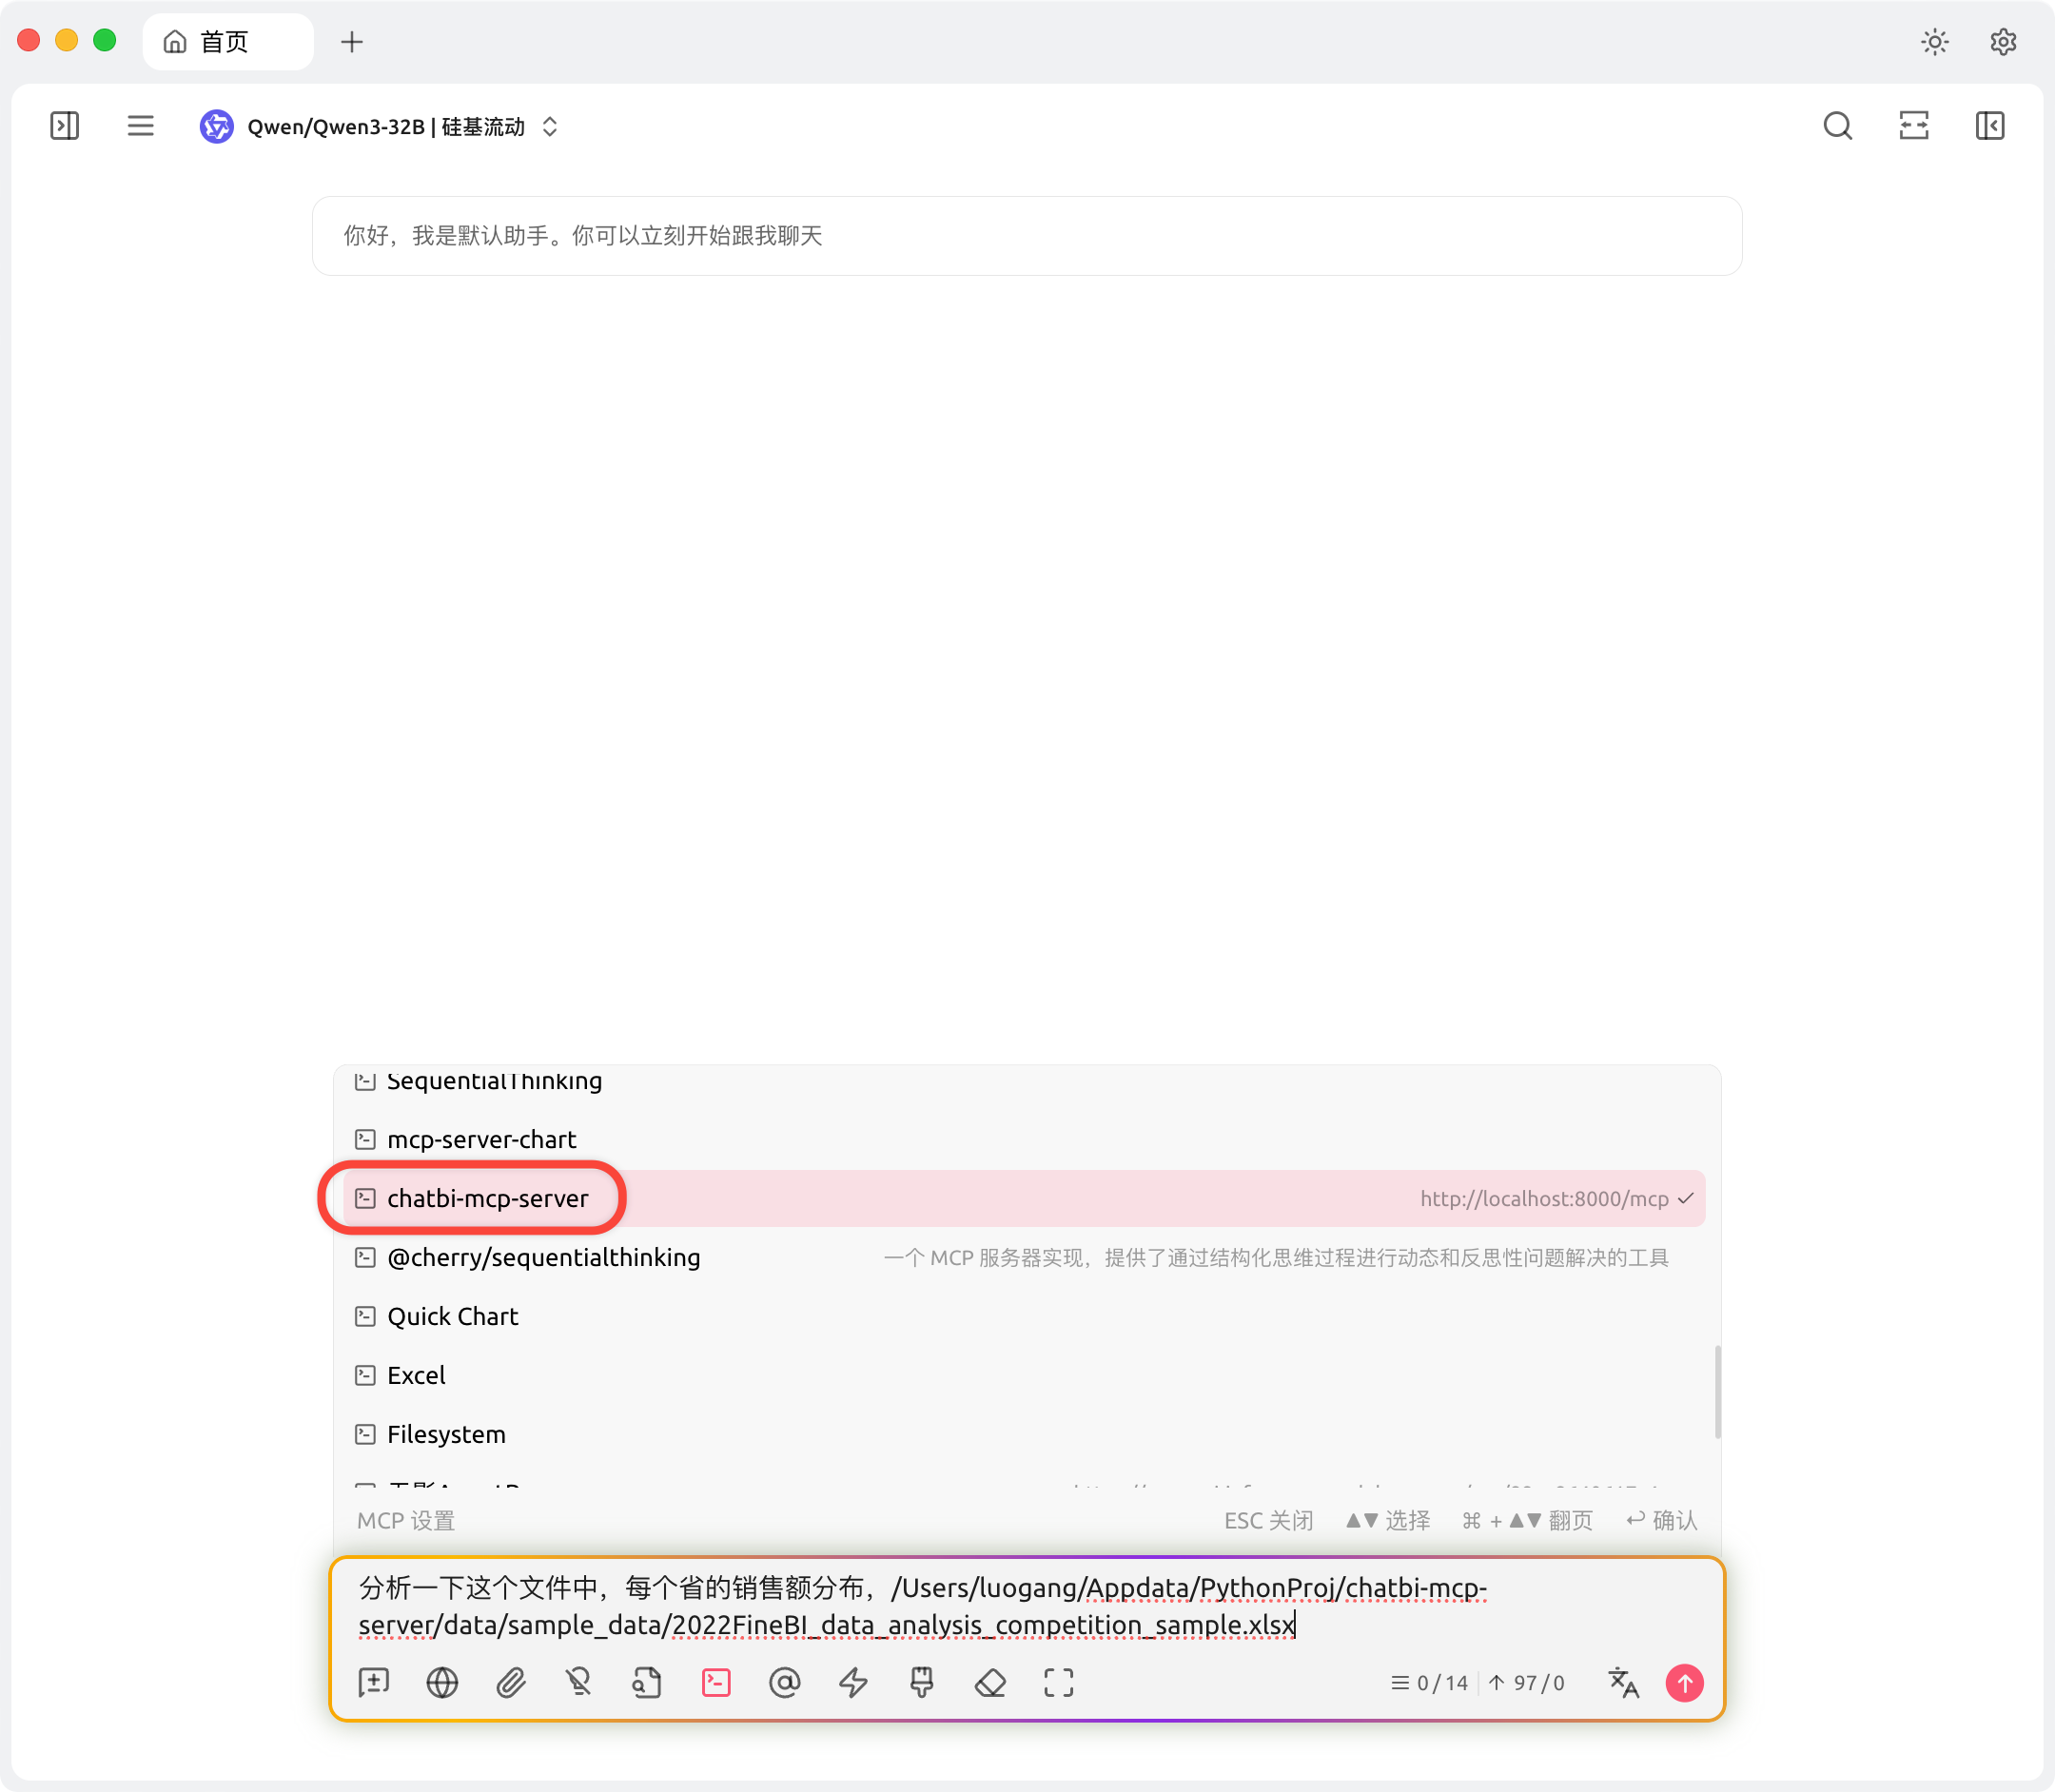
使用ChatBI MCP Server
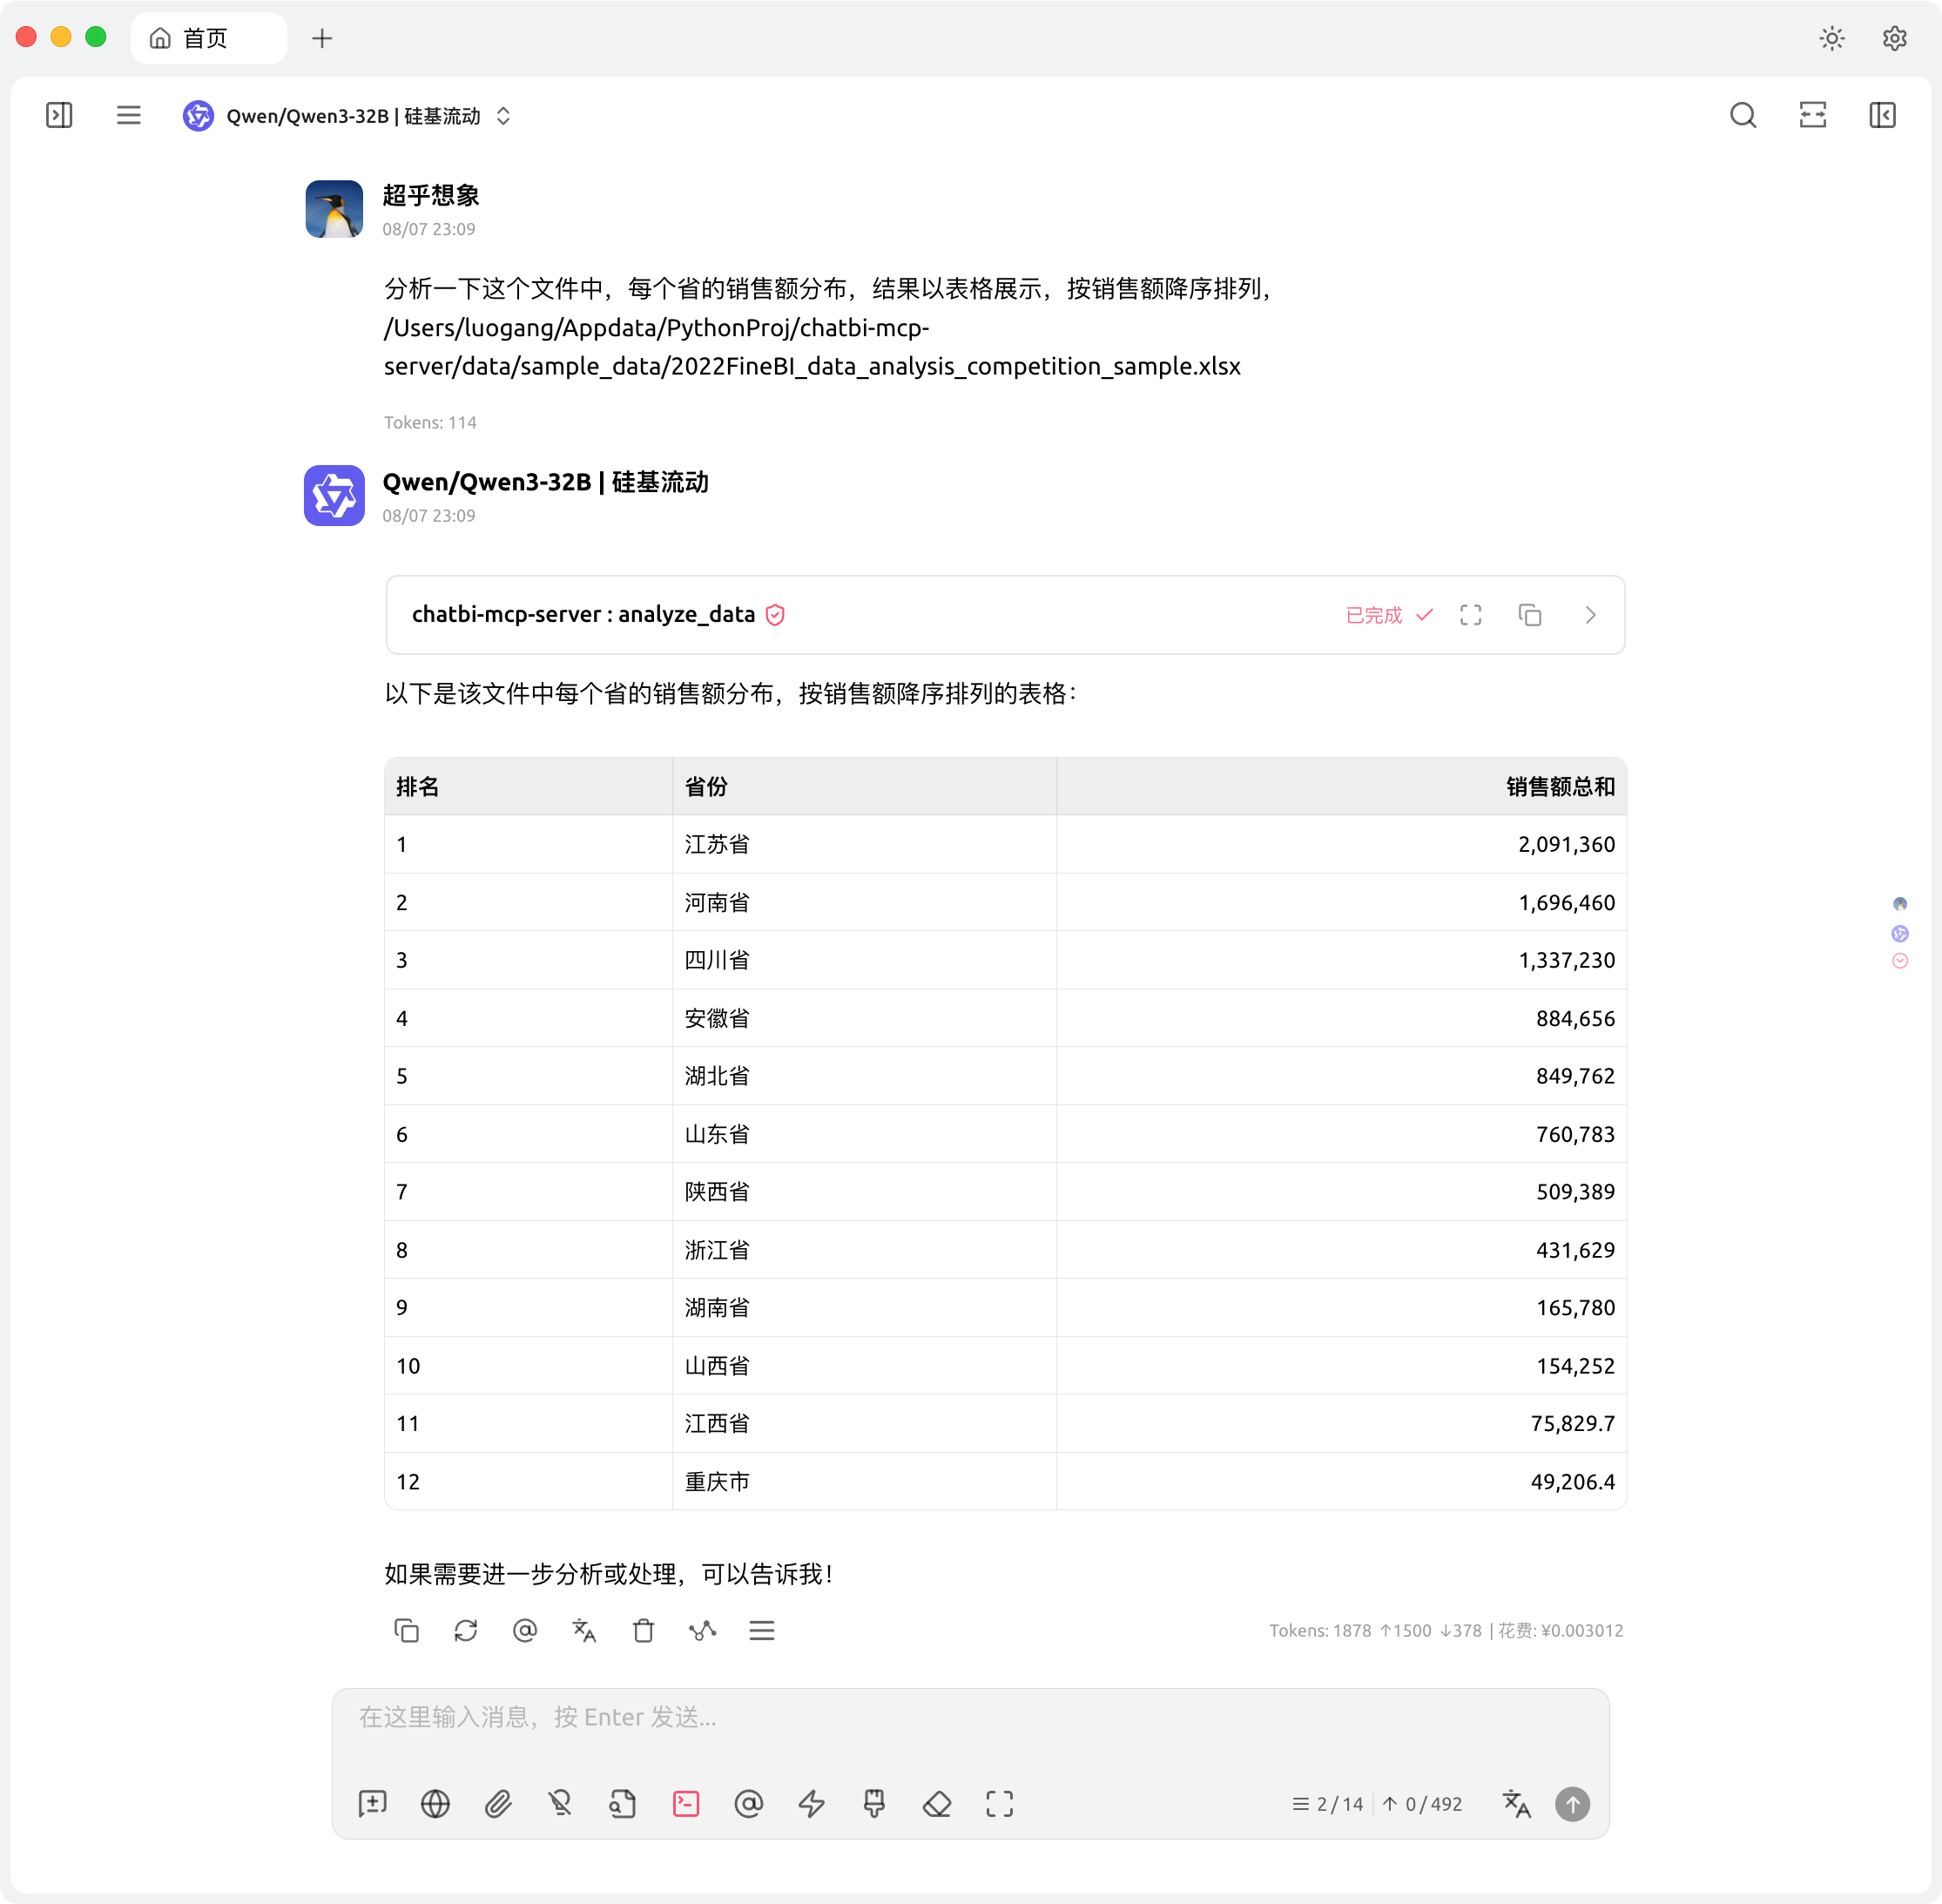
常规统计
使用时,记得开启这个MCP Server:
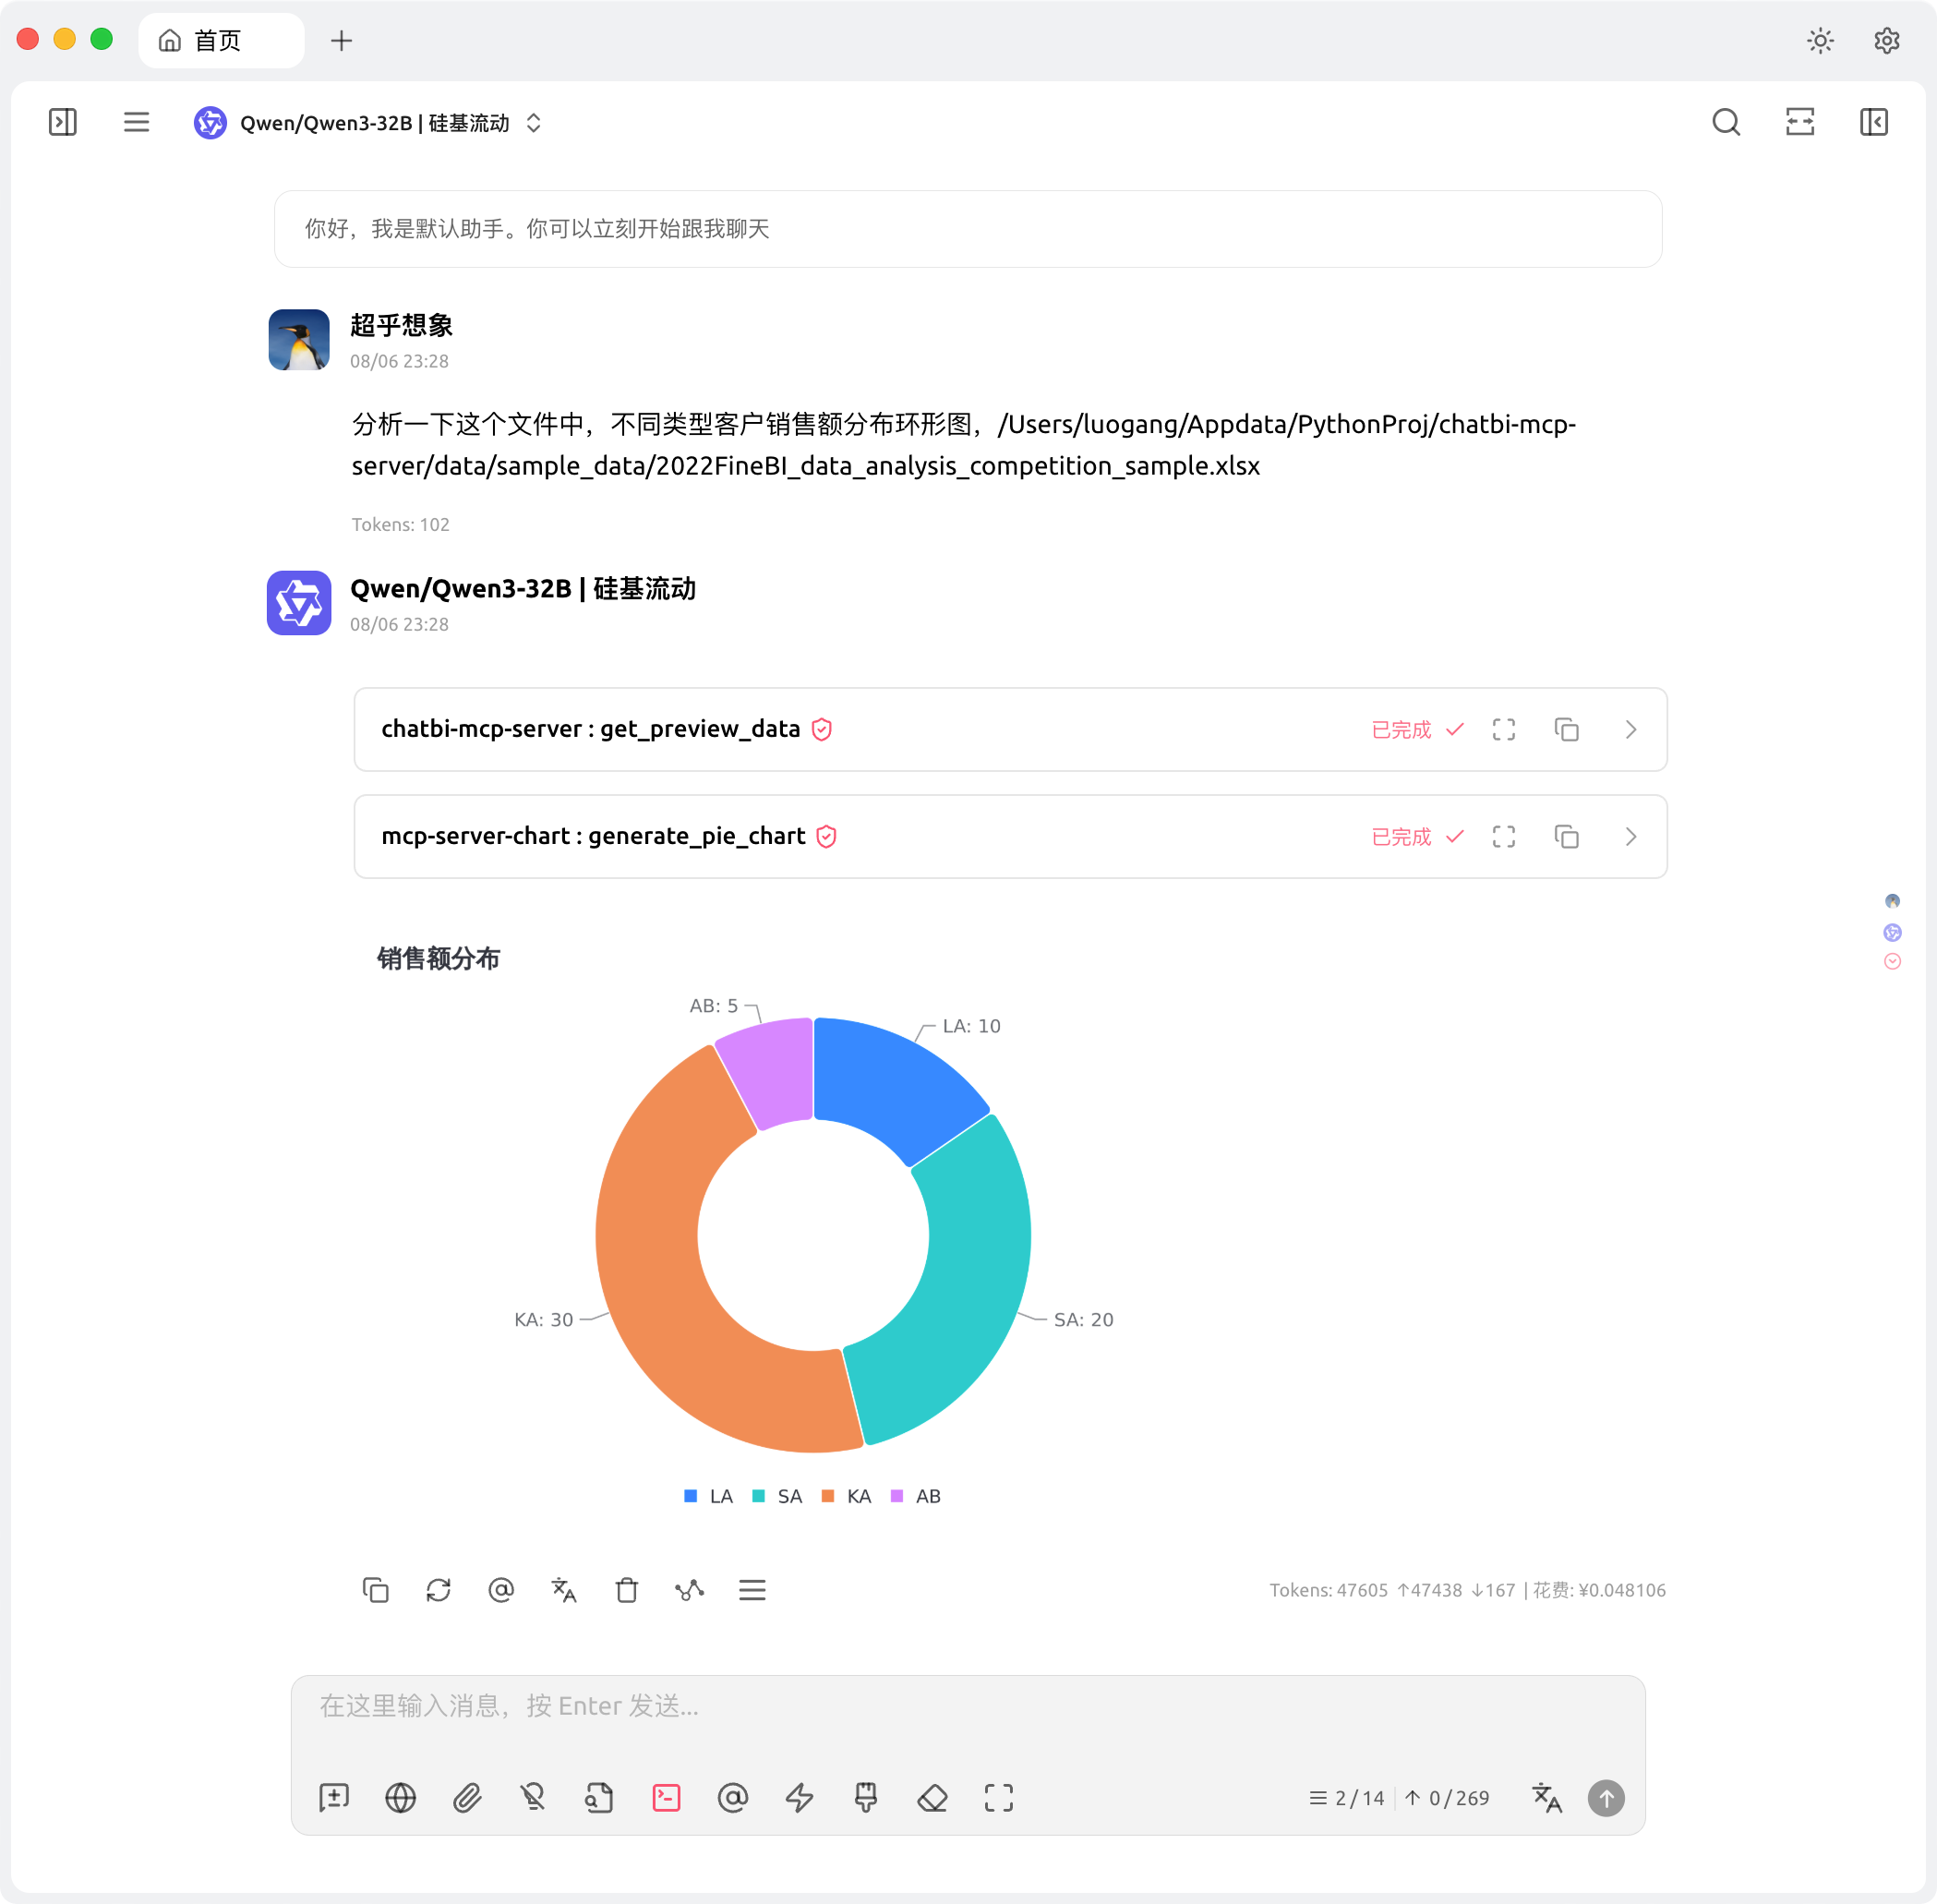
可视化
结合mcp-server-chart使用
综合运用
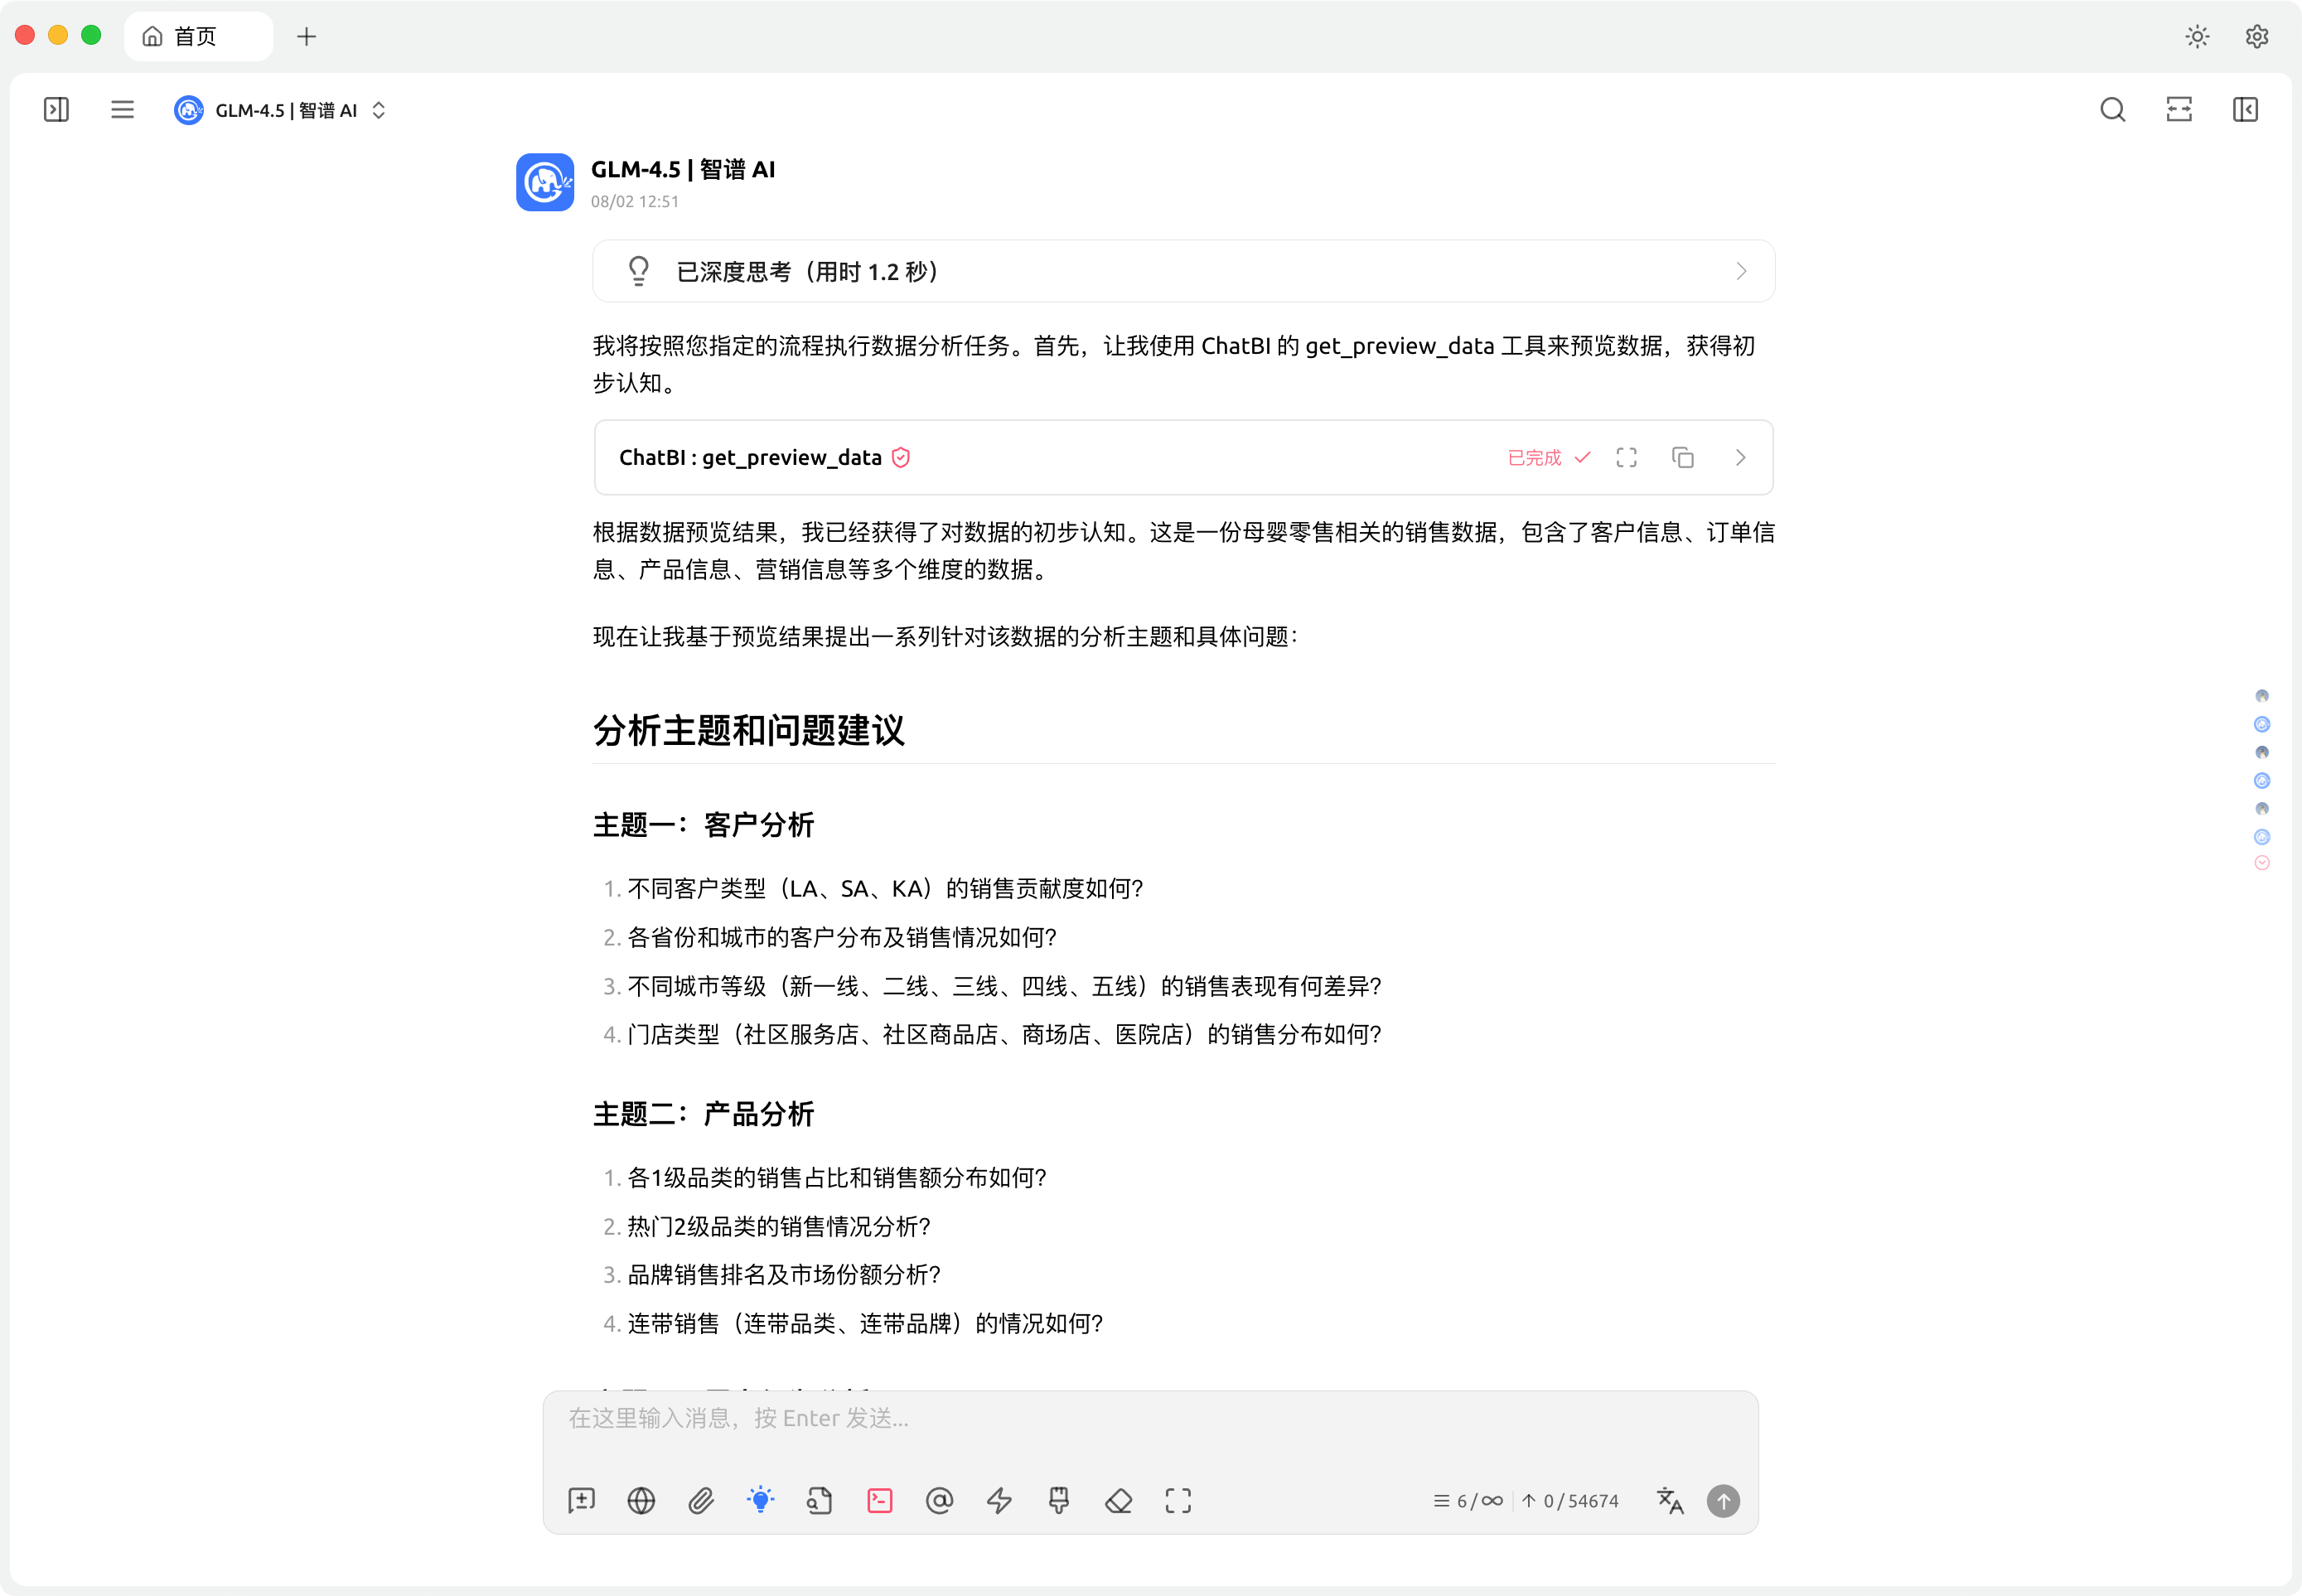
通过指令,自动化数据分析:
生成数据分析计划:
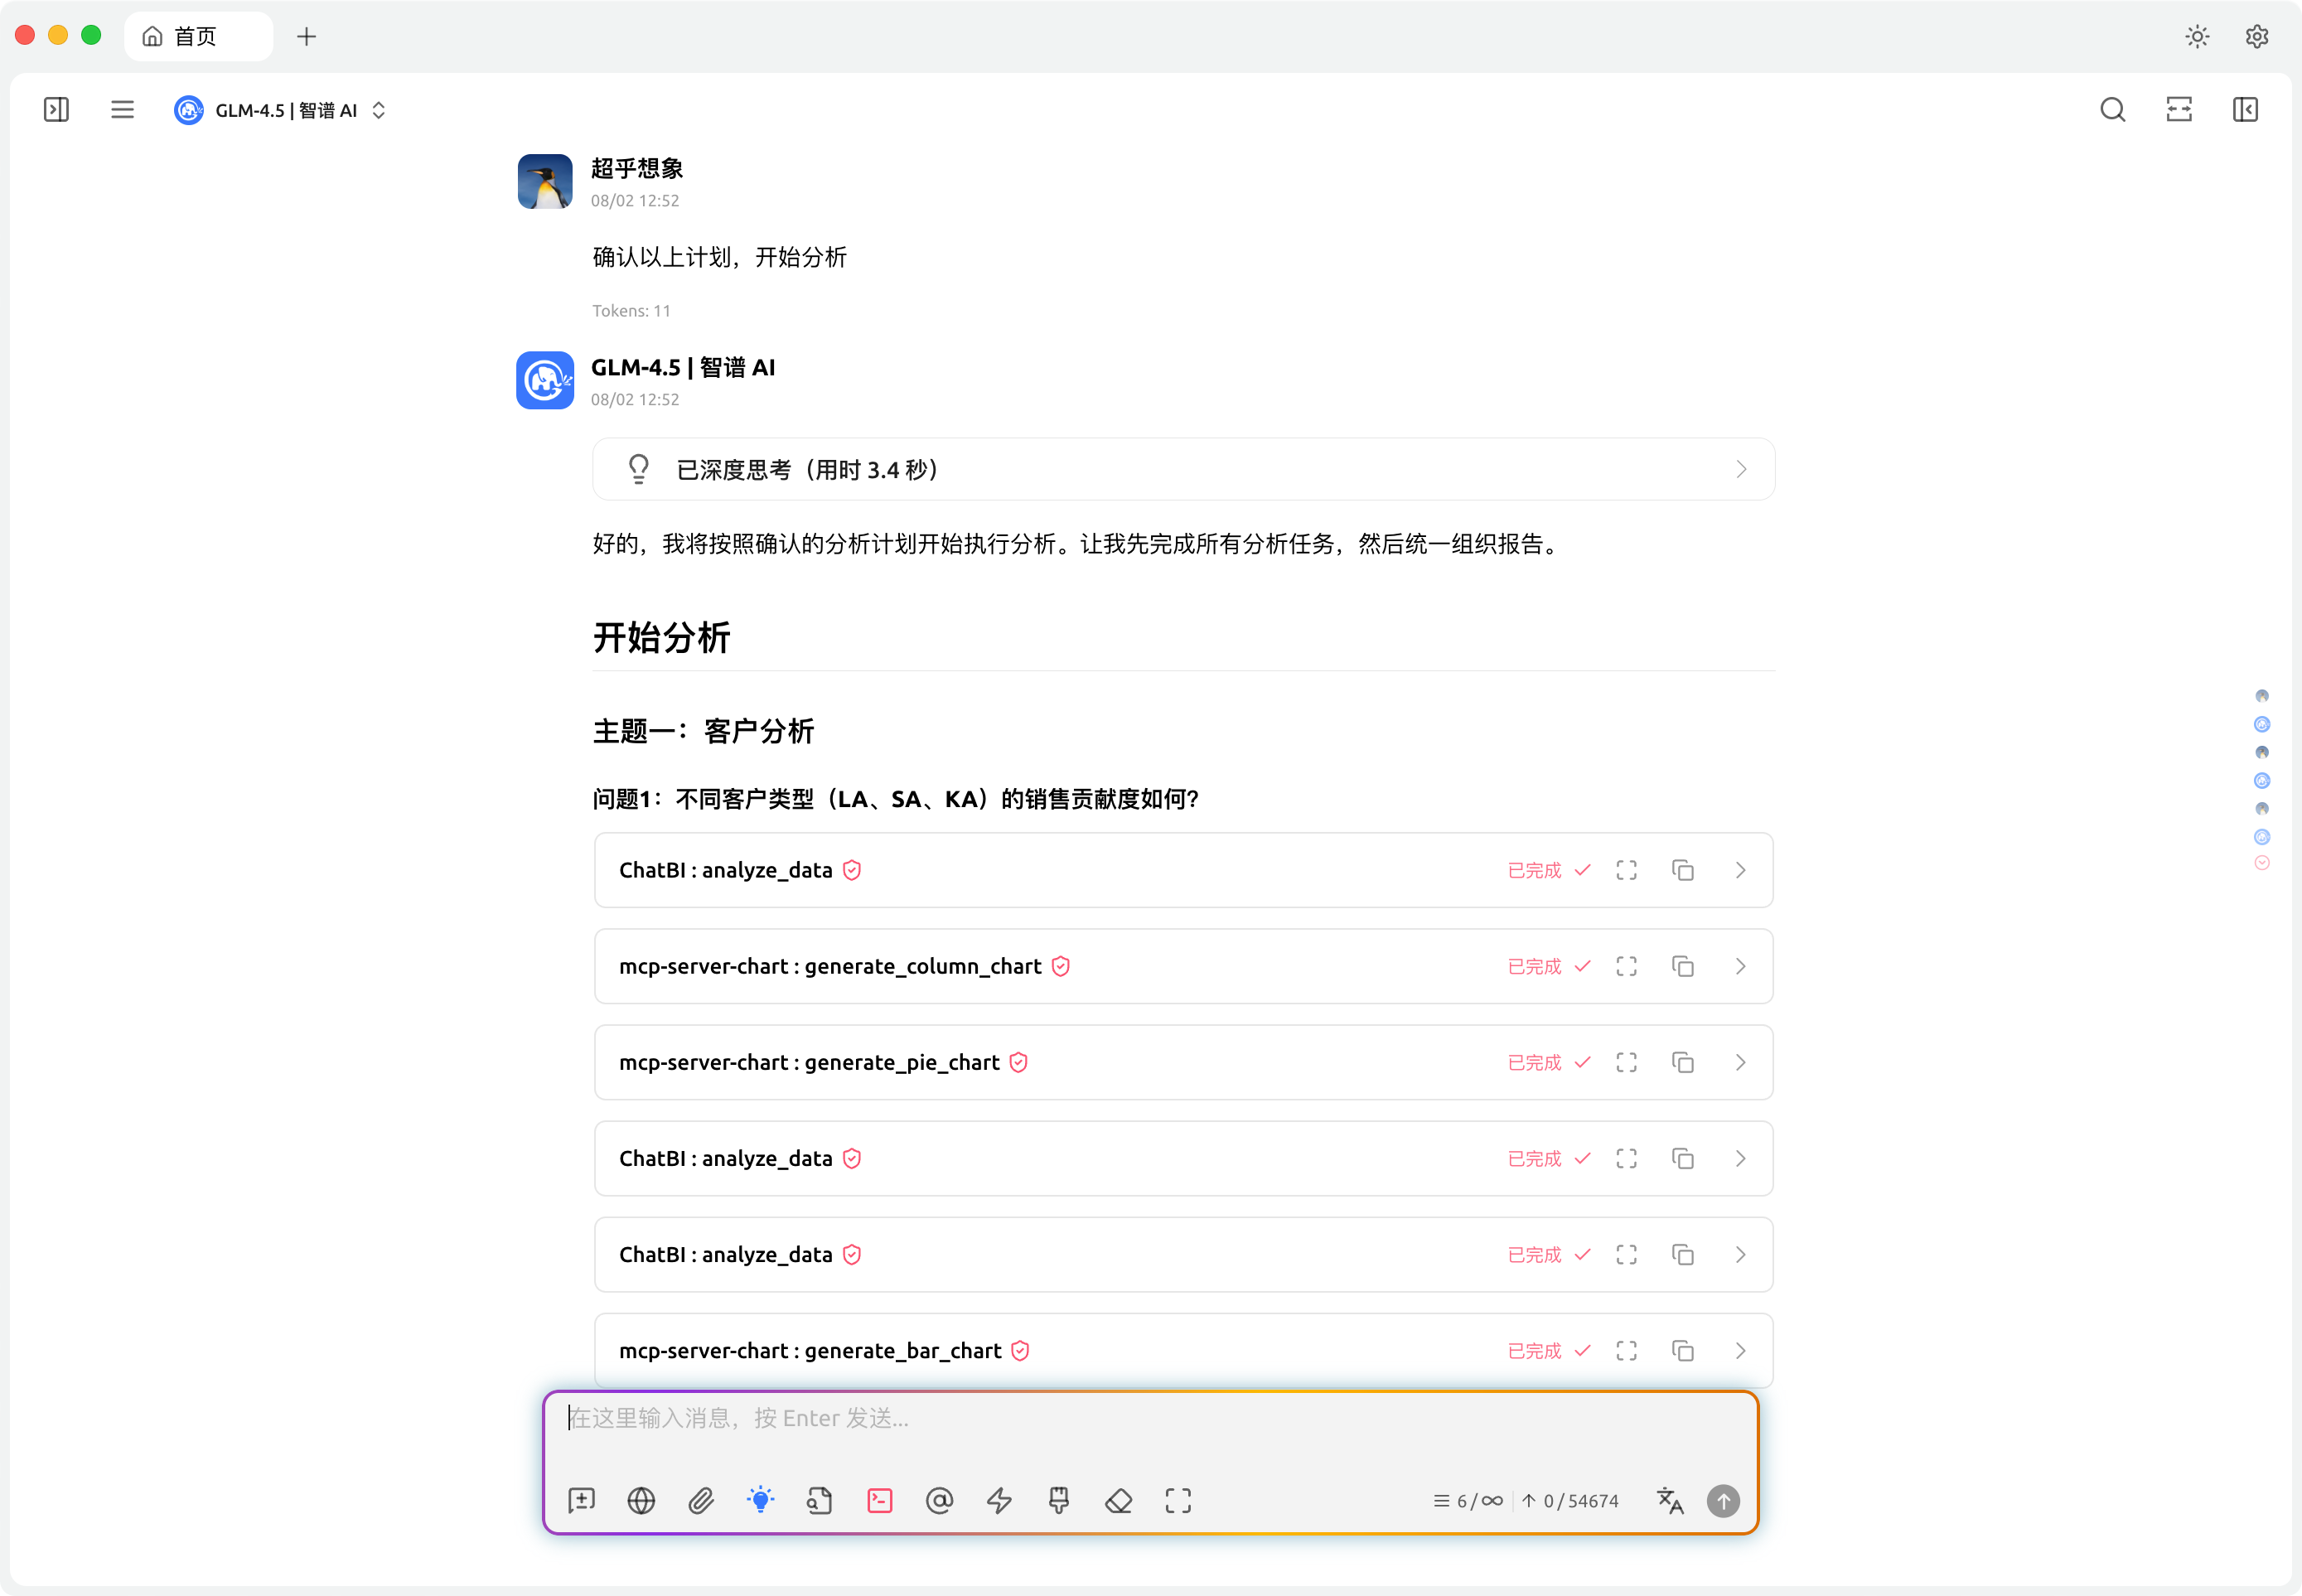
 开始分析:
开始分析:
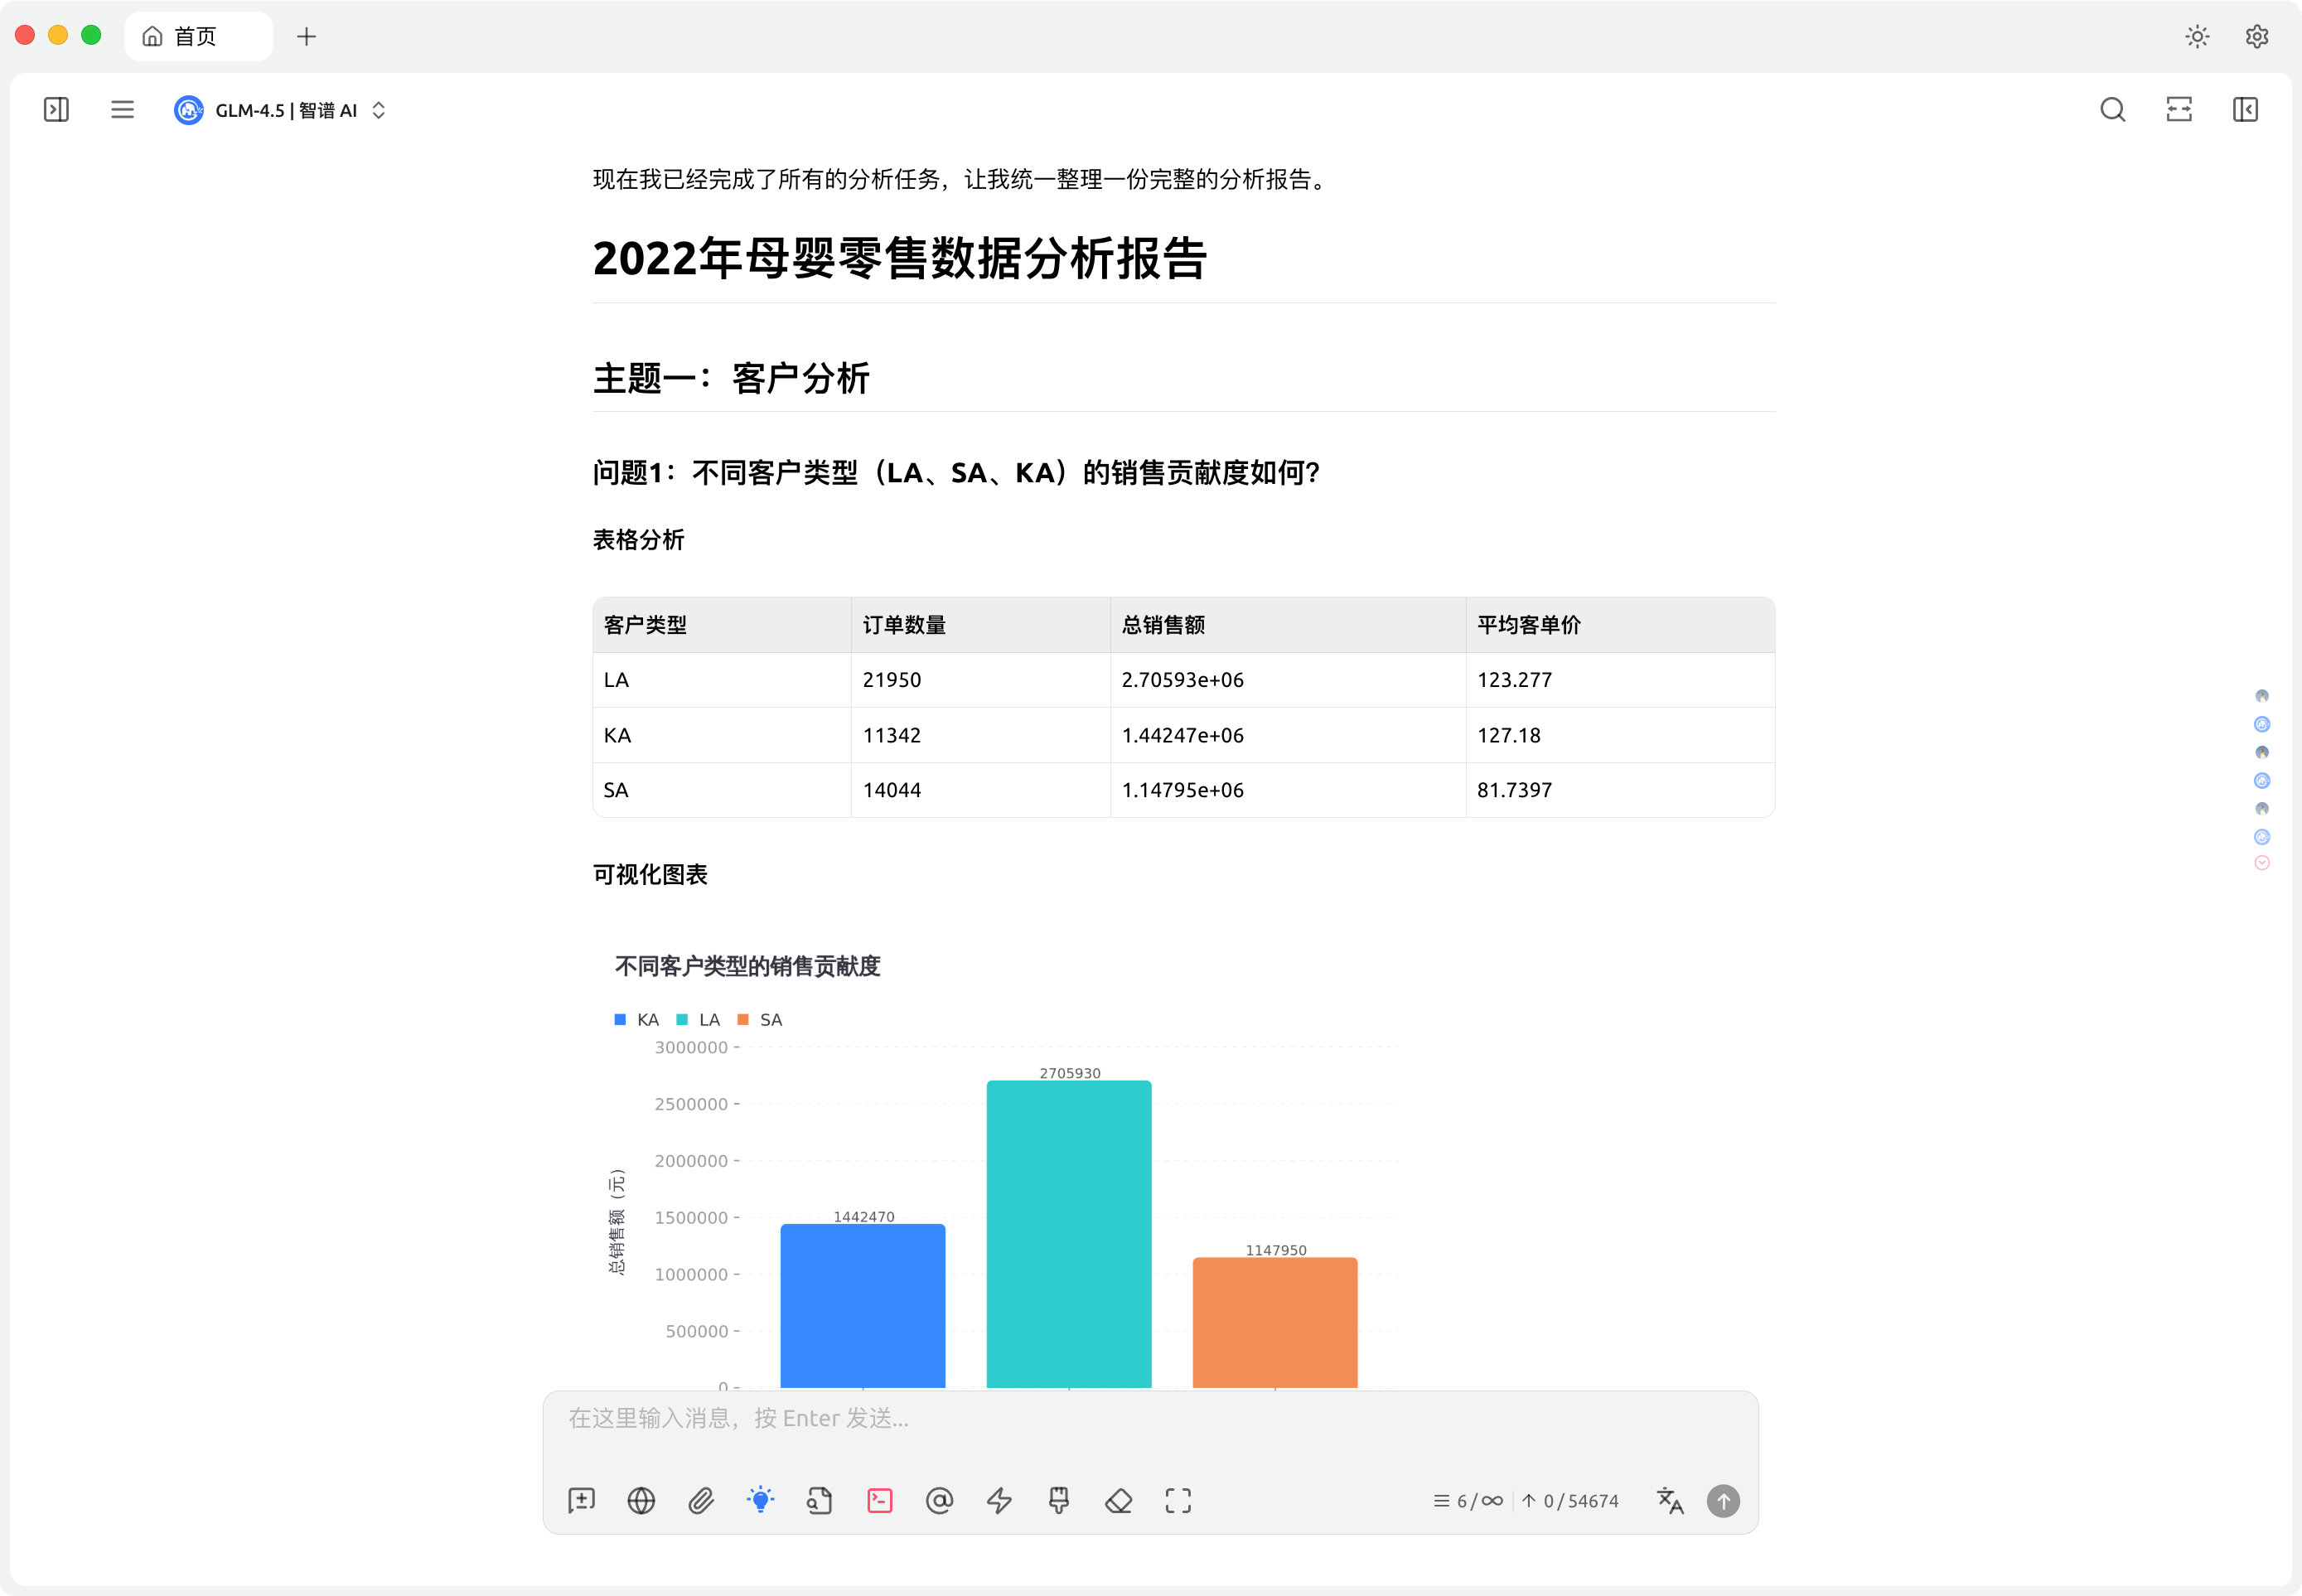
 结果报告:
结果报告:
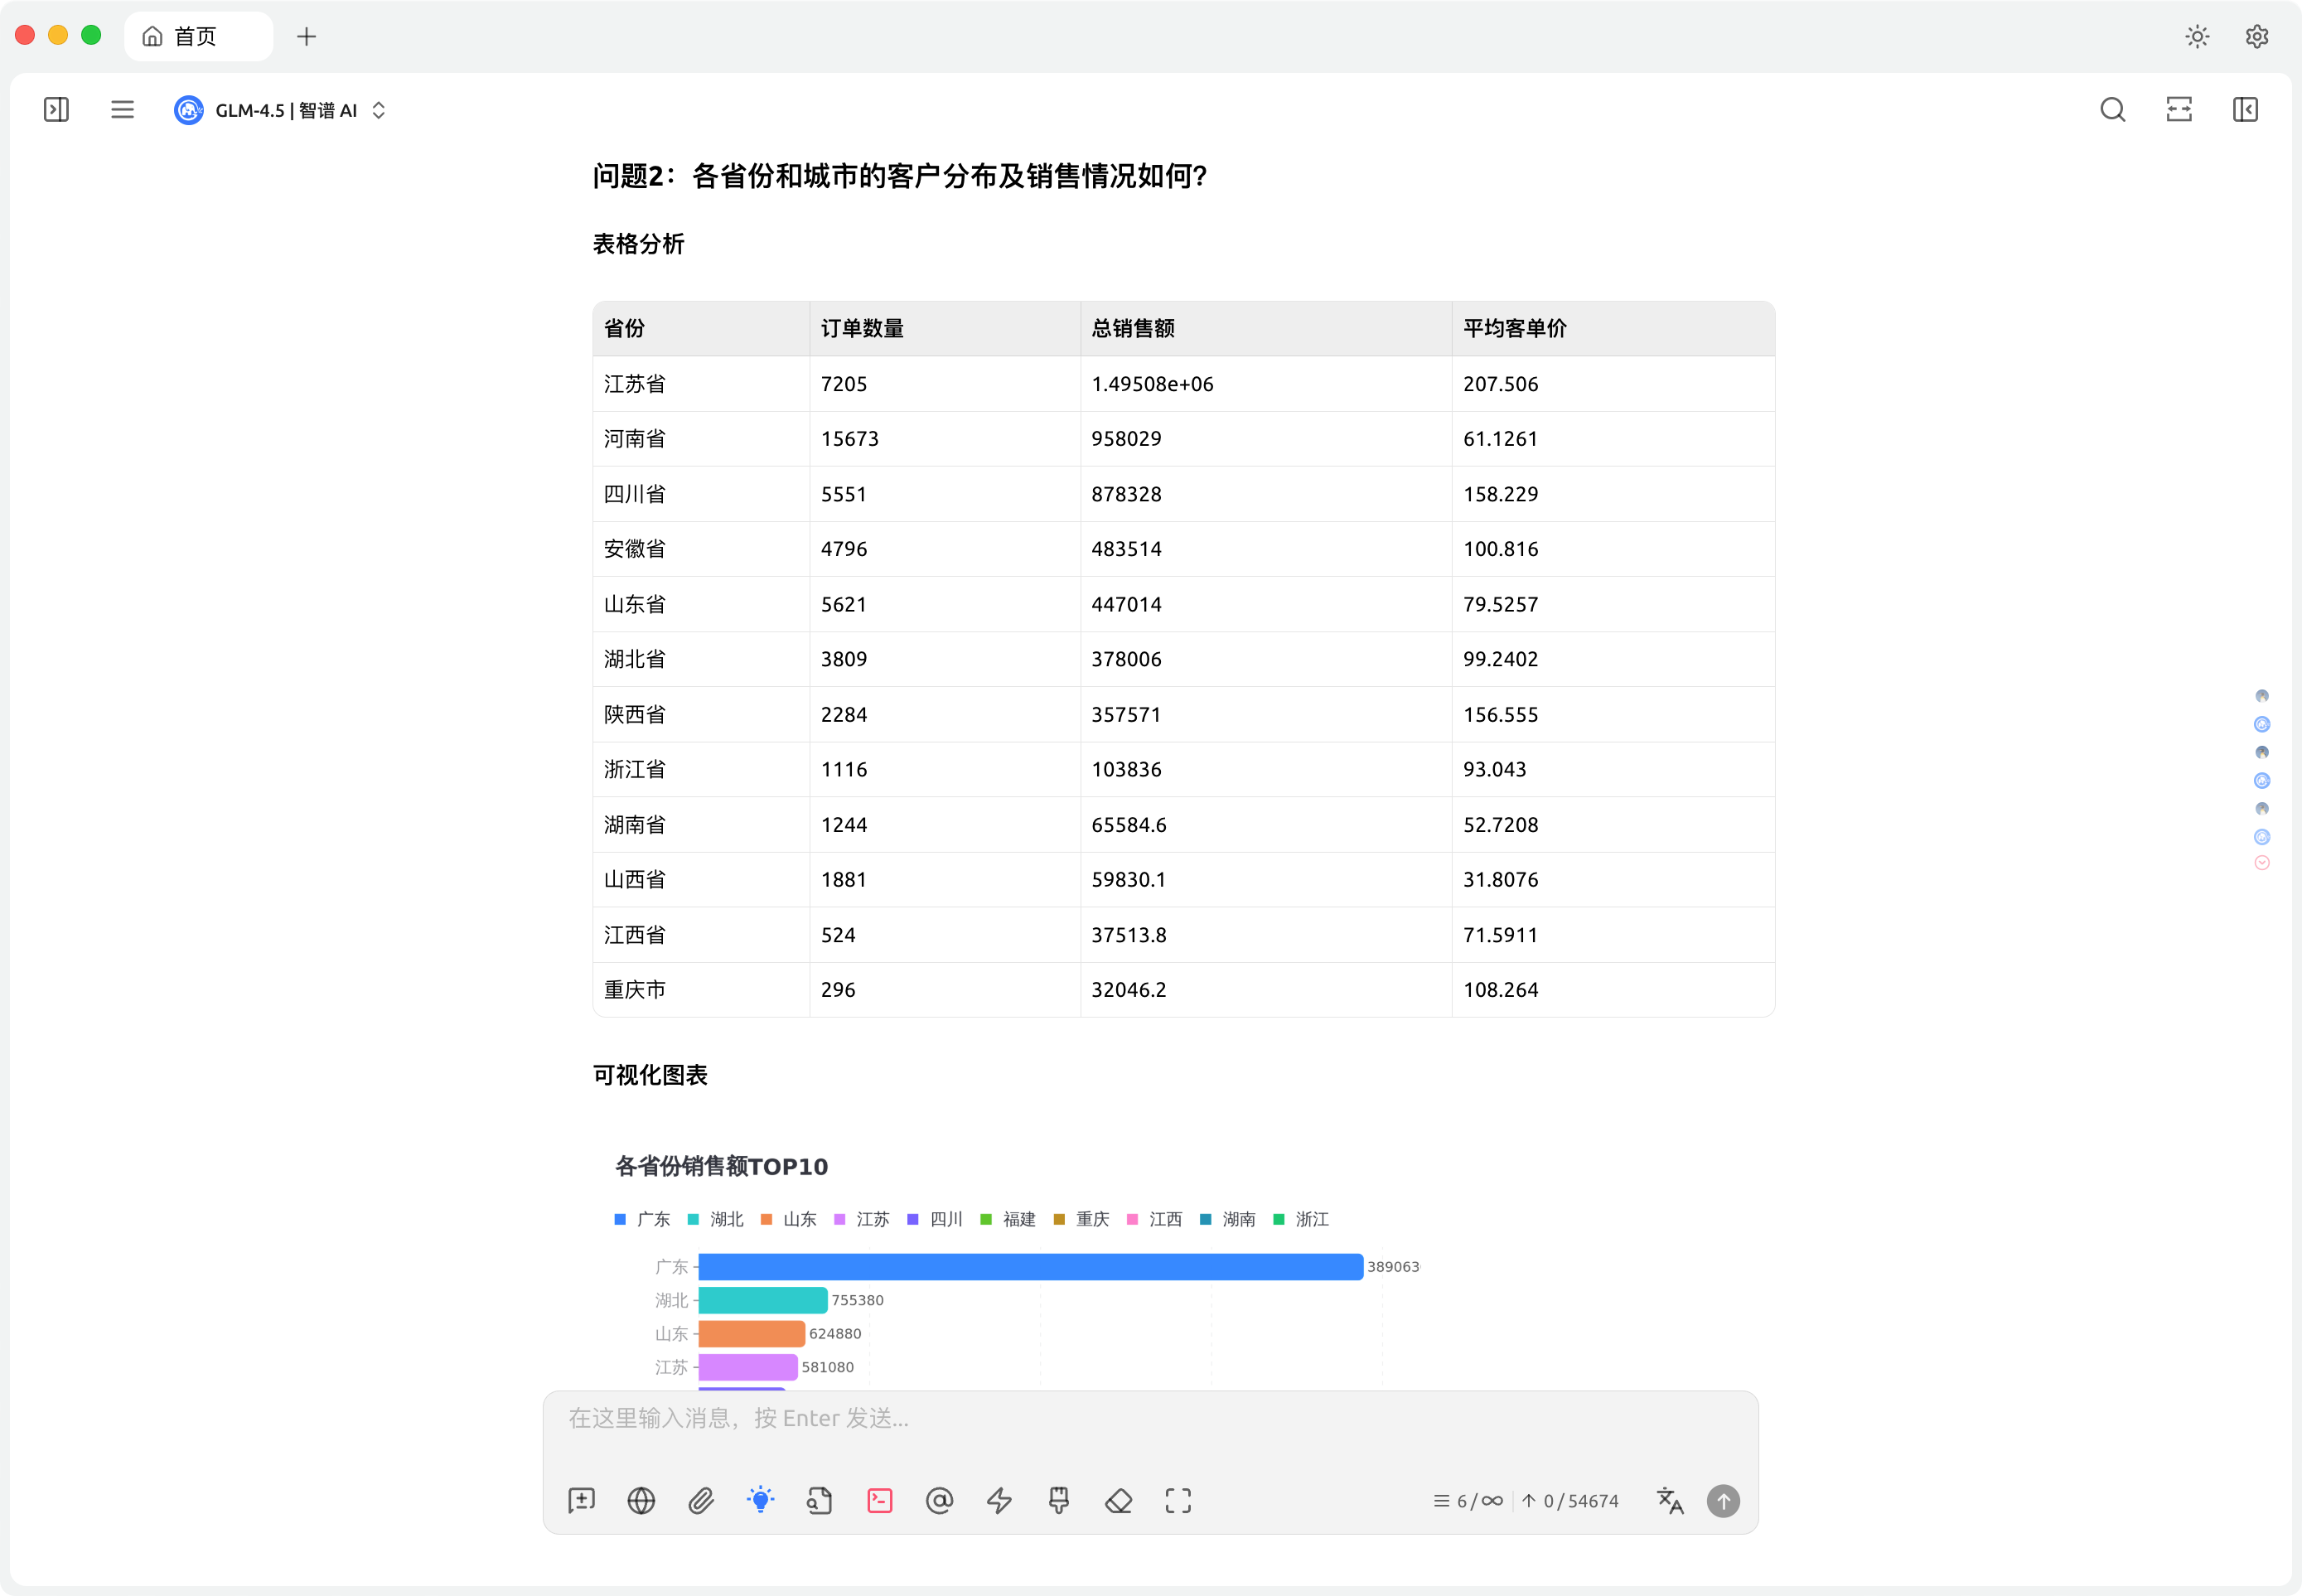
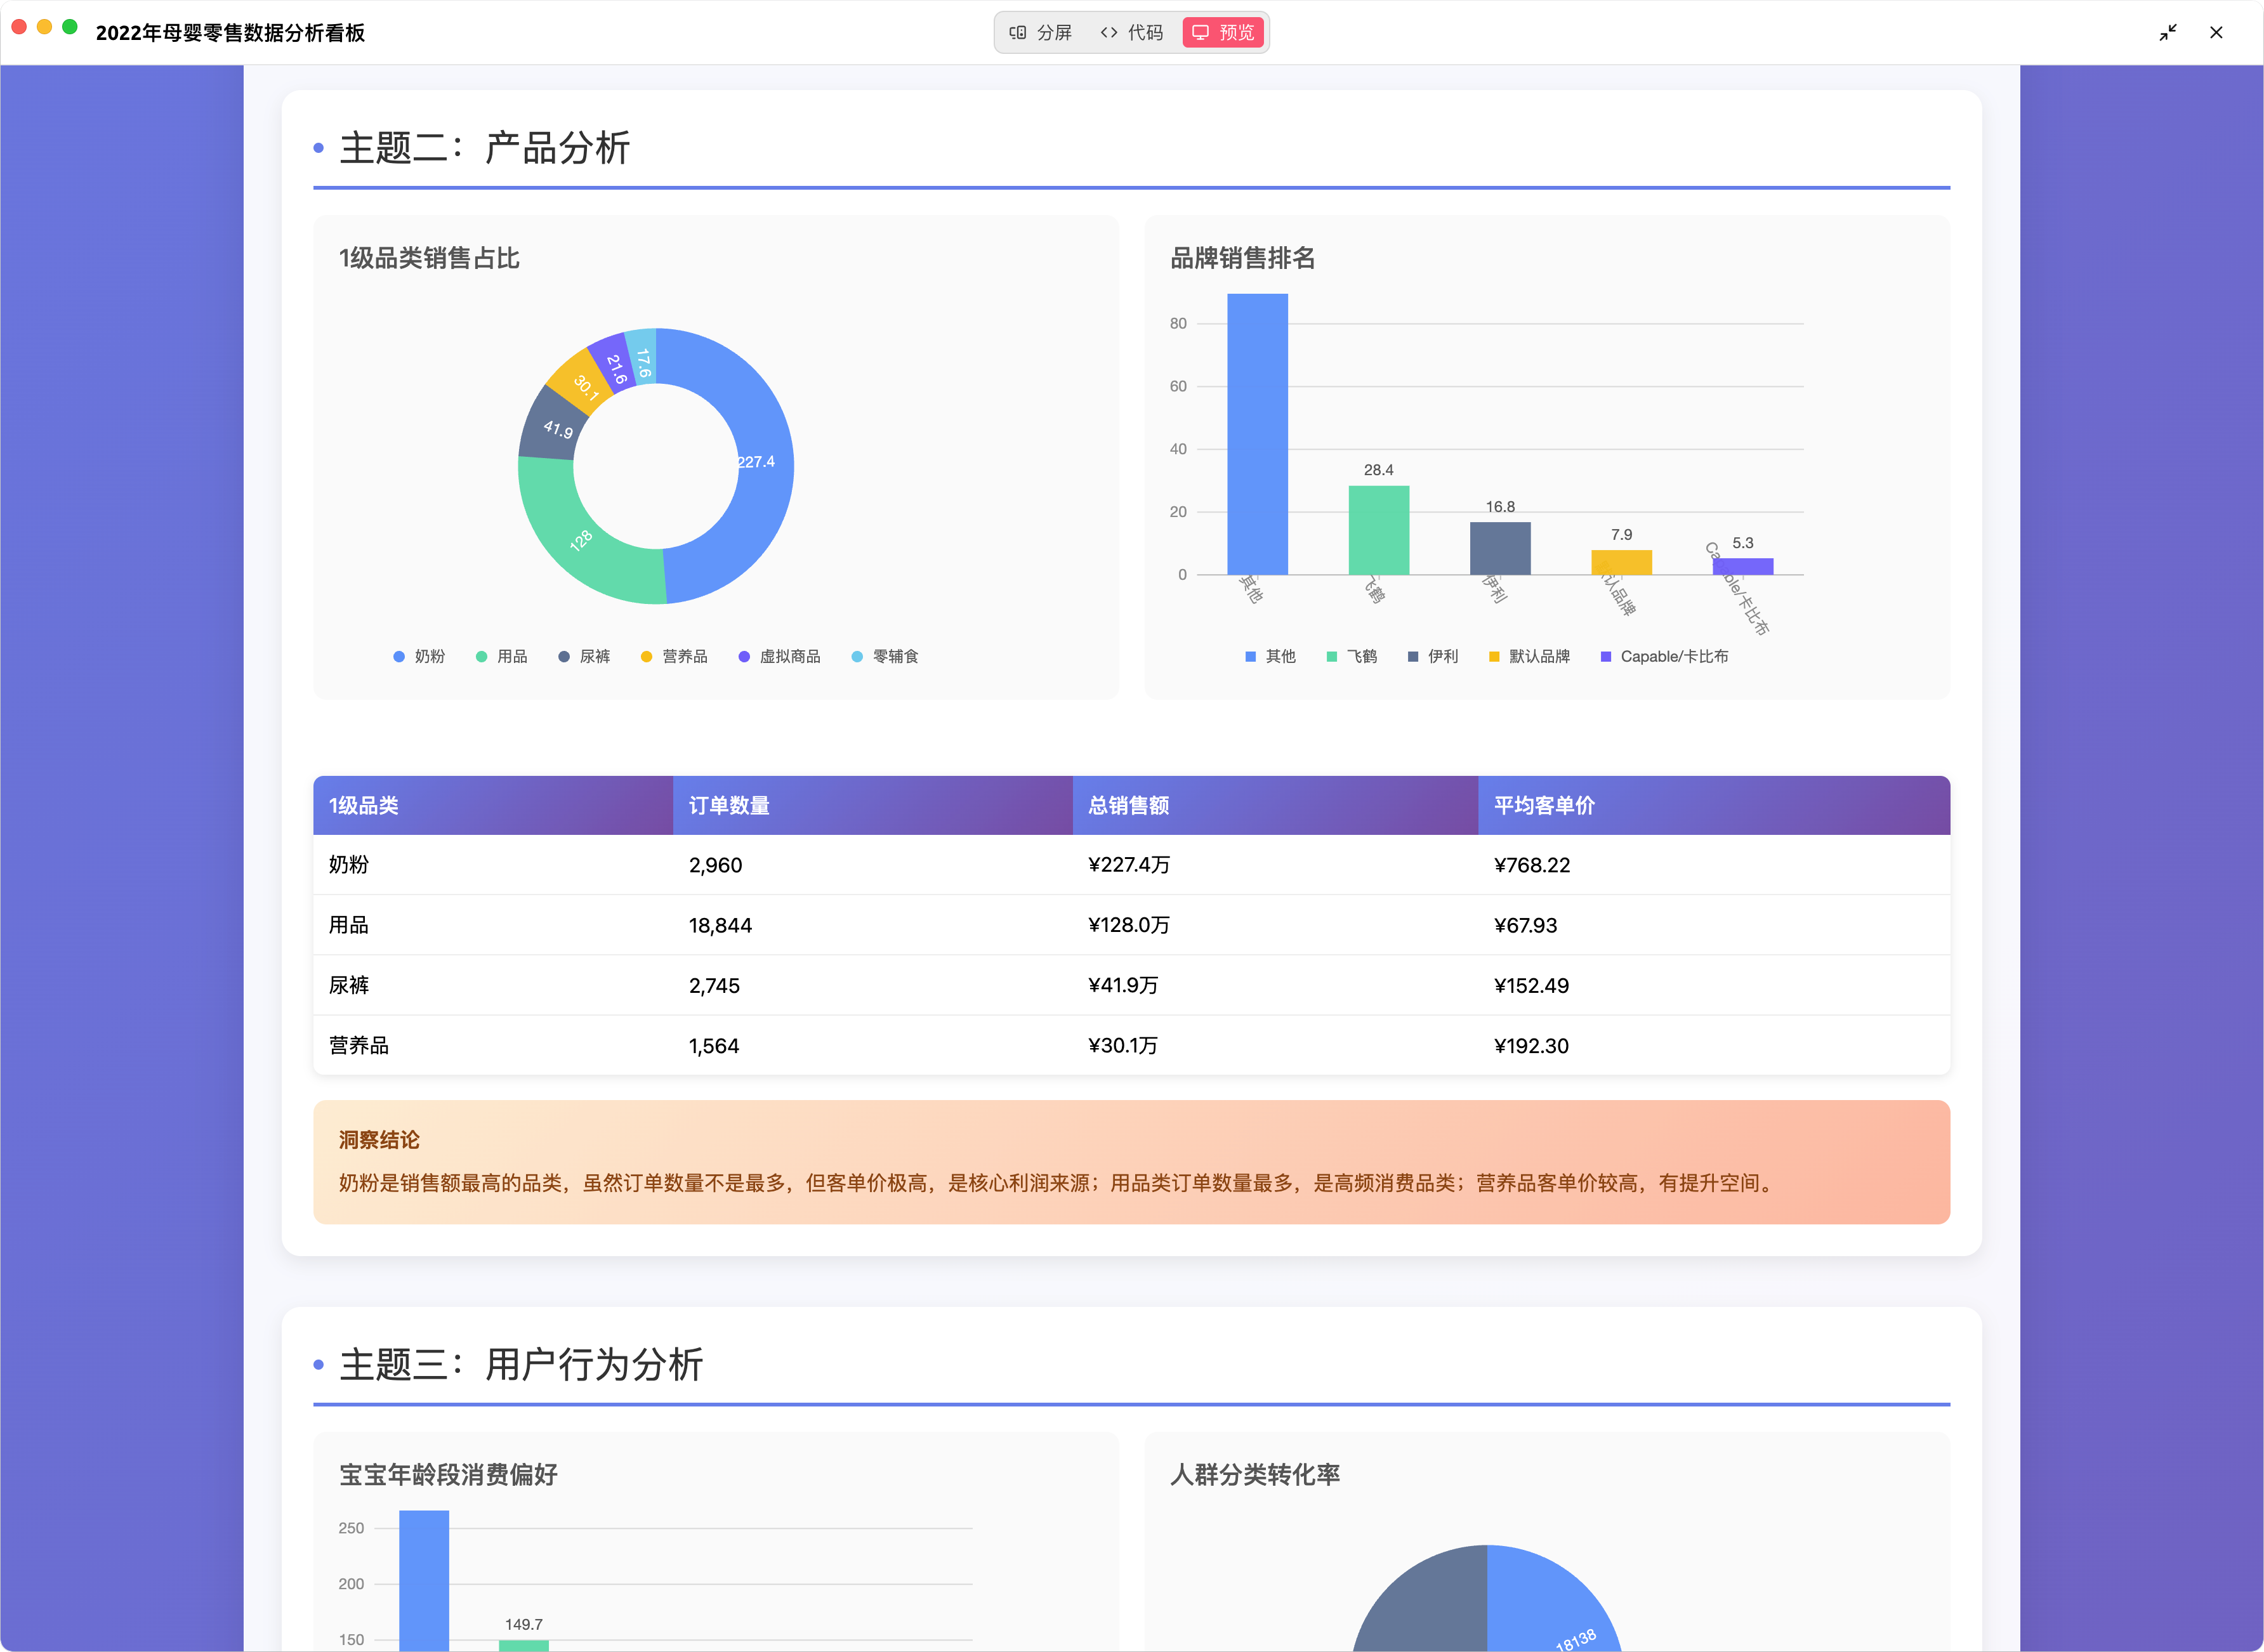
生成的看板:
This server cannot be installed
Maintenance
Resources
Unclaimed servers have limited discoverability.
Looking for Admin?
If you are the server author, to access and configure the admin panel.
Appeared in Searches
Latest Blog Posts
- Who's Calling? MCP Hosts Are an Identity Blind Spot (And the Spec Knows It)By Om-Shree-0709 on .mcpAgent IdentityOAuth 2.1
- Your AI Chatbot Just Exposed Your CEO's Salary to an InternBy Om-Shree-0709 on .Agent IdentityMCP SecurityOAuth Delegation
- Why MCP Servers Need Execution Sandboxing (And Why Your Current Stack Isn't Enough)By Om-Shree-0709 on .Agentic AiPrompt InjectionWebAssembly
MCP directory API
We provide all the information about MCP servers via our MCP API.
curl -X GET 'https://glama.ai/api/mcp/v1/servers/Steven-Luo/chatbi-mcp-server'
If you have feedback or need assistance with the MCP directory API, please join our Discord server