
Indian Stocks MCP
# indian-stocks-mcp
**A stock MCP server that cannot answer with the future.** Every tool takes an
`as_of` (YYYY-MM-DD) cutoff; rows after it are filtered in one place, and
adjusted prices are rebuilt from the corporate actions that were actually known
by then.
A vendor's "adjusted close" is not a fact about a past day — it is that day's
close multiplied by every split and dividend that happened since. So the same
date reads differently depending on when you ask:
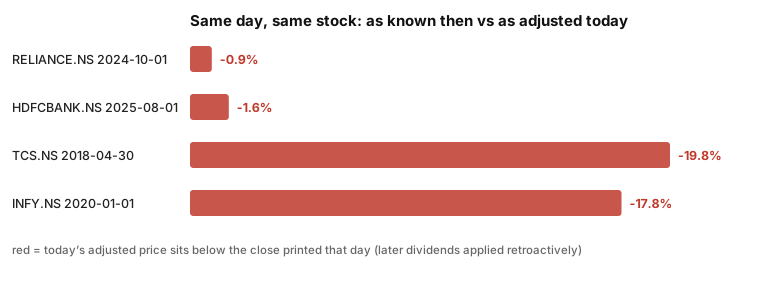
> TCS on 2018-04-30: the close printed that day was INR 1,766.05. Today's
> adjusted series reports INR 1,415.63 for the same day — 19.8% lower. A stop
> level or a position size computed on the second number was decided with
> information from the future.
Run the measurement yourself: `uv run python demo/vintage_drift.py`.
Seven tools over historical price data — OHLC, returns, technical indicators,
chart patterns (candlesticks + support/resistance), risk metrics, index history,
peer comparison — all cut off at `as_of`.
```bash
# Install from the release (no account, no API key):
uvx --from https://github.com/Shubhampm18/indian-stocks-mcp/releases/download/v0.3.0/indian_stocks_mcp-0.3.0-py3-none-any.whl indian-stocks-mcp
```
## Install
```bash
uv sync
uv run pytest -q # leak + pattern suites
uv build
uvx --from https://github.com/Shubhampm18/indian-stocks-mcp/releases/download/v0.3.0/indian_stocks_mcp-0.3.0-py3-none-any.whl indian-stocks-mcp
```
From a local build instead: `uv build && uvx --from ./dist/indian_stocks_mcp-0.3.0-py3-none-any.whl indian-stocks-mcp`.
## MCP client config
```json
{
"mcpServers": {
"indian-stocks": {
"command": "uvx",
"args": ["--from", "https://github.com/Shubhampm18/indian-stocks-mcp/releases/download/v0.3.0/indian_stocks_mcp-0.3.0-py3-none-any.whl", "indian-stocks-mcp"]
}
}
}
```
Claude Desktop (config: `claude_desktop_config.json`), Cursor (`.cursor/mcp.json`), etc. accept the same block. No API key; data comes from yfinance (research/personal use, cached locally in Parquet).
## The `as_of` guarantee
- Every tool accepts `as_of` (YYYY-MM-DD). All rows are filtered to `date <= as_of` in a single helper (`enforce_as_of` in `src/stock_analyst_mcp/data.py`), and the response echoes `data_through`.
- Adjusted prices are **rebuilt from corporate actions with ex-date ≤ as_of only** — a dividend paid later cannot change an earlier price. Dividends use the standard factor method: `factor = 1 - div / close_on_day_before_ex_date`, multiplied into all pre-ex prices (not flat cash subtraction), with the as-filed cash rebased into the current share basis when a split happened afterwards. (This is the adjustment-vintage test in `tests/test_leak.py`.)
- **Splits are already adjusted by the source.** yfinance's `Close` is split-adjusted, so this server deliberately does *not* re-apply split ratios (doing so halves every pre-split row and invents a ~+100% jump on the ex-date). `adjustment_history` records each split with `applied: false` and the reason. Consequence, stated plainly: the as-filed **price** of a pre-split date cannot be recovered from this source — ratios and returns are unaffected, absolute pre-split levels are in the current share basis.
- A future `as_of` raises `isError: true`; an unknown symbol raises `isError: true` with "Did you mean …?" suggestions.
- Nothing is printed to stdout (stdio JSON-RPC would corrupt); all logging goes to stderr.
## Tools
| Tool | What it returns |
|---|---|
| `get_ohlcv(symbol, as_of?, lookback_days=90)` | Daily OHLC + rebuilt adjusted close + `adjustment_history` |
| `get_returns(symbol, as_of?, windows=[1,5,20,60])` | Simple/log returns per window (pandas) |
| `get_technical_indicators(symbol, as_of?, indicators=[…])` | SMA/EMA/RSI/MACD/Bollinger/ATR/VWAP computed in Python, never LLM math; `trend` field |
| `get_chart_patterns(symbol, as_of?, lookback_days=120, window=20)` | Candlestick patterns (hammer, shooting star, doji, engulfing, stars) over the last `window` bars + pivot support/resistance levels with nearest levels |
| `get_risk_metrics(symbol, as_of?, benchmark="^NSEI", lookback_days=252)` | Sharpe, Sortino, max drawdown (start/end), volatility, beta, alpha |
| `get_index_history(index, as_of?, lookback_days=90)` | `^NSEI` / `^BSESN` / `^NSEBANK` close series |
| `get_peer_comparison(symbols, as_of?, metric="return_20d")` | Side-by-side values + ranks on one metric |
Every output carries `source` (`"yfinance"`), `as_of` (echoed), `data_through`, `rows_used` (rows available after as_of filtering, before lookback trimming), and `currency` (`"INR"`).
## Demo
> Did Reliance beat TCS over the last 20 sessions as of 31 Dec 2025?
```
get_peer_comparison(symbols=["RELIANCE.NS", "TCS.NS"], as_of="2025-12-31", metric="return_20d")
```
→ ranked results for the two symbols, `data_through` on or before 2025-12-31, plus the peer `current_price` for each. Re-checkable in one yfinance call: `yf.Ticker("RELIANCE.NS").history(...)`.
## How this differs from existing NSE MCP servers (measured, Nov 2026)
- **FinMCP** ([Finance-LLMs/FinMCP](https://github.com/Finance-LLMs/FinMCP), MIT) fetches live NSE/BSE quotes via `nsepython`/`bse` (see `MCP_tools/indian_markets.py`) — **no `as_of` parameter, no test directory**. A side-by-side comparison run (same 3 queries against both servers) was performed during development but is **not re-runnable from this repo** — the comparison script was never committed.
- **Tapetide** (48 tools) advertises point-in-time tools but runs on a closed remote (`mcp.tapetide.com`); the public repo is only a stdio→HTTPS bridge with zero date logic.
- This server's value is the last two columns: mandatory `as_of` with server-side enforcement, and a runnable leak suite (`tests/test_leak.py`: cutoff shrink, canary spike, future-date error, vintage rebuild, pandas recomputation match).
## Data notes
- Suffixes: `.NS` = NSE, `.BO` = BSE. Bare tickers default to `.NS`. Use `.BO` explicitly for BSE — bare tickers are always treated as NSE, and an unknown bare ticker will error with "Did you mean...?" suggestions rather than guessing an exchange.
- Cache: `~/.cache/stock-analyst-mcp/` — Parquet cache with a **24-hour TTL**; older caches are refetched, and a network failure falls back to the stale cache with a stderr warning. Pass `force_refresh=True` internally to bypass the TTL.
- Market hours: 09:15–15:30 IST, Mon–Fri. Weekends/holidays roll back to the last trading day (`data_through` reports it).
- yfinance is research/personal use only; do not redistribute raw data commercially. Cache: `~/.cache/stock-analyst-mcp/`.
## Tests
```bash
uv run pytest -q
```
Leak + pattern suites: 41 passing (21 point-in-time/leak/provenance tests + 20 chart-pattern tests; the 3 network-dependent leak tests skip when offline — the pure-logic cutoff/vintage/pattern tests never skip).
**Console-script note:** the current command is `indian-stocks-mcp`. The distribution also registers a legacy `stock-analyst-mcp` script for back-compat with older local invocations — it runs the same `stock_analyst_mcp:main` entry point.
## License
MIT — see [LICENSE](https://github.com/Shubhampm18/indian-stocks-mcp/blob/main/LICENSE).
## Credits
Built with the official `mcp` Python SDK. yfinance usage follows https://ranaroussi.github.io/yfinance/advanced/price_adjustment.html (`auto_adjust=False` + local adjustment-vintage rebuild is why this server can answer "as of" honestly).
TDQS
Scored across 7 tools
Each tool maps to a distinct analytical output (raw OHLCV, returns, indicators, patterns, risk, index history, peer comparison), so an agent can generally pick correctly. The only mild overlaps are get_ohlcv vs get_index_history and get_returns vs get_risk_metrics, both separated by symbol type and metric nature but requiring a quick read of descriptions.
Every tool follows the exact get_<noun> pattern (get_ohlcv, get_returns, get_technical_indicators, etc.), all snake_case with a uniform verb. No deviations or mixed conventions.
Seven tools is well within the ideal 3-15 range for a data/analytics server. Each tool covers a distinct analysis layer (prices, returns, indicators, patterns, risk, index, peers) with no filler.
The technical/quant analytics surface is broad and coherent: raw data, derived metrics, patterns, risk, benchmark, and peer comparison. Minor gaps remain — no symbol search/lookup, and no fundamental or corporate-action data — but agents can work around these if the analytical focus is technical.