A
licenseC
qualityD
maintenanceA Model Context Protocol (MCP) server implementation that allows AI assistants to run k6 load tests through natural language commands, supporting custom test durations and virtual users.
2
26
MIT

This server lets you run and analyze JMeter performance tests through MCP-compatible clients.
Execute JMeter tests in GUI or non-GUI mode, with optional JMeter properties and report dashboard generation.
Analyze test results from JTL files, including key metrics and detailed summaries.
Identify performance bottlenecks such as slow endpoints, high error rates, and anomalies.
Get performance insights with actionable recommendations for improvements.
Generate visualizations like time series graphs, distribution charts, endpoint comparisons, and comprehensive HTML reports.
Click on "Deploy Server".
Wait a few minutes for the server to deploy. Once ready, it will show a "Started" state.
In the chat, type @ followed by the MCP server name and your instructions, e.g., "@JMeter MCP Server run the load test for the login endpoint and analyze the results"
That's it! The server will respond to your query, and you can continue using it as needed.
Here is a step-by-step guide with screenshots.
This is a Model Context Protocol (MCP) server that allows executing JMeter tests through MCP-compatible clients and analyzing test results.
📢 Looking for an AI Assistant inside JMeter? 🚀 Check outFeather Wand
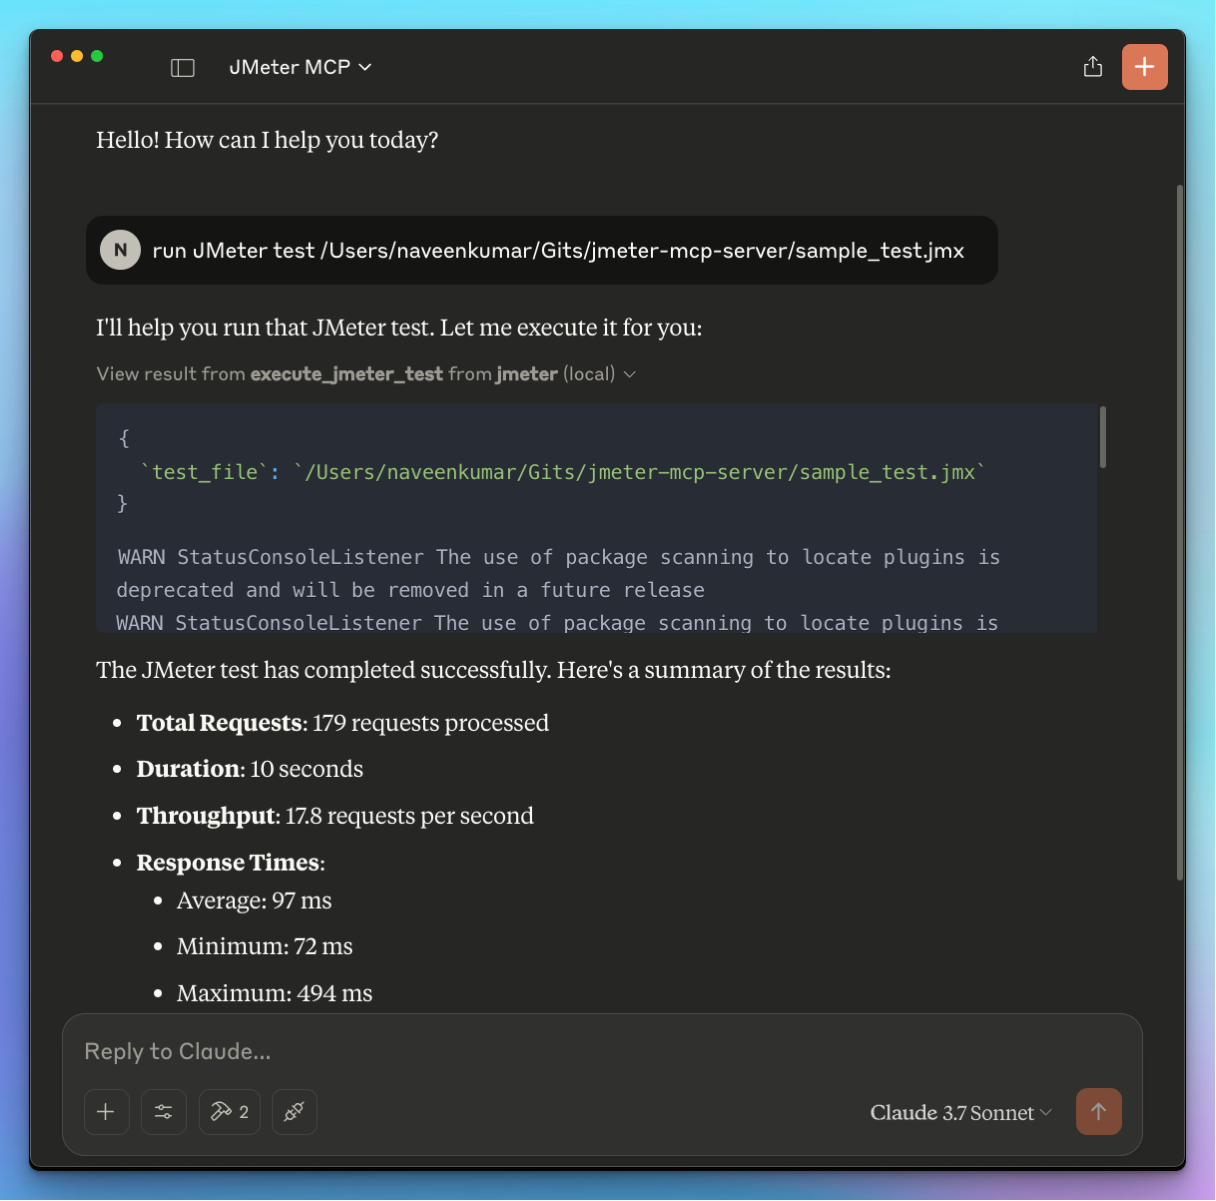
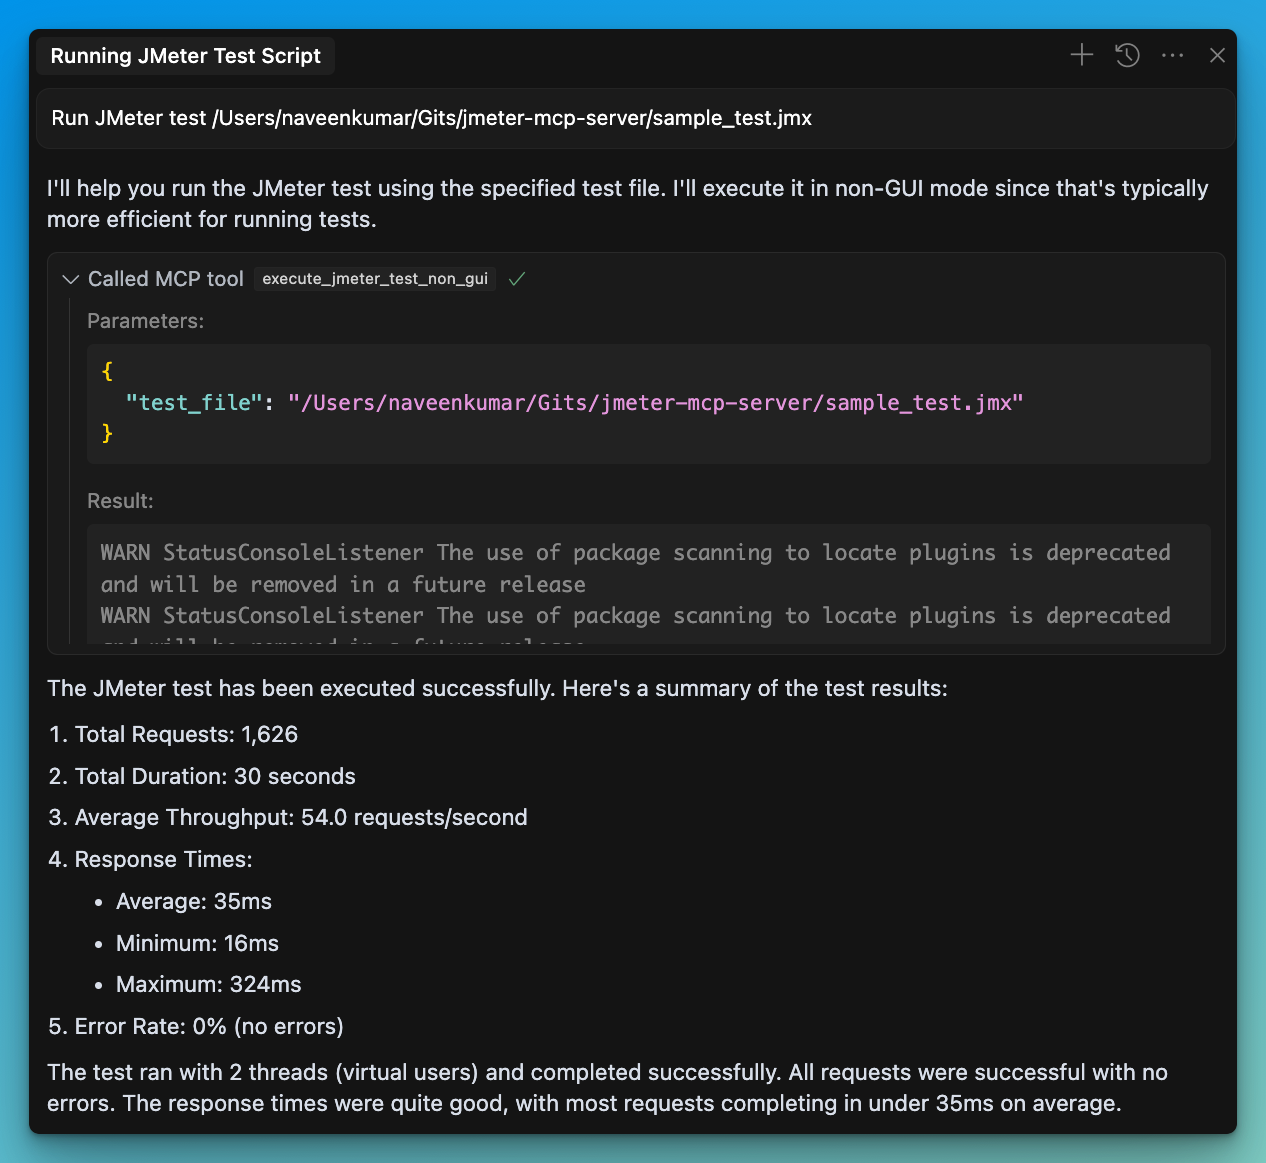

📊 Execute JMeter tests in non-GUI mode
🖥️ Launch JMeter in GUI mode
📝 Capture and return execution output
📊 Generate JMeter report dashboard
📈 Parse and analyze JMeter test results (JTL files)
📊 Calculate comprehensive performance metrics
🔍 Identify performance bottlenecks automatically
💡 Generate actionable insights and recommendations
📊 Create visualizations of test results
📑 Generate HTML reports with analysis results
Related MCP server: MCP Server
Install uv:
Ensure JMeter is installed on your system and accessible via the command line.
⚠️ Important: Make sure JMeter is executable. You can do this by running:
chmod +x /path/to/jmeter/bin/jmeterInstall required Python dependencies:
pip install -r requirements.txtConfigure the .env file, refer to the .env.example file for details.
# JMeter Configuration
JMETER_HOME=/path/to/apache-jmeter-5.6.3
JMETER_BIN=${JMETER_HOME}/bin/jmeter

# Optional: JMeter Java options
JMETER_JAVA_OPTS="-Xms1g -Xmx2g"Connect to the server using an MCP-compatible client (e.g., Claude Desktop, Cursor, Windsurf)
Send a prompt to the server:
Run JMeter test /path/to/test.jmxMCP compatible client will use the available tools:
🖥️ execute_jmeter_test: Launches JMeter in GUI mode, but doesn't execute test as per the JMeter design
🚀 execute_jmeter_test_non_gui: Execute a JMeter test in non-GUI mode (default mode for better performance)
📊 analyze_jmeter_results: Analyze JMeter test results and provide a summary of key metrics and insights
🔍 identify_performance_bottlenecks: Identify performance bottlenecks in JMeter test results
💡 get_performance_insights: Get insights and recommendations for improving performance
📈 generate_visualization: Generate visualizations of JMeter test results
Add the following configuration to your MCP client config:
{
    "mcpServers": {
      "jmeter": {
        "command": "/path/to/uv",
        "args": [
          "--directory",
          "/path/to/jmeter-mcp-server",
          "run",
          "jmeter_server.py"
        ]
      }
    }
}Run JMeter tests in non-GUI mode for better performance
Launch JMeter in GUI mode for test development
Generate JMeter report dashboards
Analyze JTL files to understand performance characteristics
Identify performance bottlenecks and their severity
Get actionable recommendations for performance improvements
Generate visualizations for better understanding of results
Create comprehensive HTML reports for sharing with stakeholders
The server will:
Validate that the test file exists
Check that the file has a .jmx extension
Validate that JTL files exist and have valid formats
Capture and return any execution or analysis errors
The Test Results Analyzer is a powerful feature that helps you understand your JMeter test results better. It consists of several components:
Supports both XML and CSV JTL formats
Efficiently processes large files with streaming parsers
Validates file formats and handles errors gracefully
Calculates overall performance metrics (average, median, percentiles)
Provides endpoint-specific metrics for detailed analysis
Generates time series metrics to track performance over time
Compares metrics with benchmarks for context
Identifies slow endpoints based on response times
Detects error-prone endpoints with high error rates
Finds response time anomalies and outliers
Analyzes the impact of concurrency on performance
Provides specific recommendations for addressing bottlenecks
Analyzes error patterns and suggests solutions
Generates insights on scaling behavior and capacity limits
Prioritizes recommendations based on potential impact
Creates time series graphs showing performance over time
Generates distribution graphs for response time analysis
Produces endpoint comparison charts for identifying issues
Creates comprehensive HTML reports with all analysis results
# Run a JMeter test and generate a results file
Run JMeter test sample_test.jmx in non-GUI mode and save results to results.jtl

# Analyze the results
Analyze the JMeter test results in results.jtl and provide detailed insights

# Identify bottlenecks
What are the performance bottlenecks in the results.jtl file?

# Get recommendations
What recommendations do you have for improving performance based on results.jtl?

# Generate visualizations
Create a time series graph of response times from results.jtlAnalyze JMeter test results and provide a summary of key metrics and insights.
Args: jtl_file: Path to the JTL file containing test results detailed: Whether to include detailed analysis (default: False)
Returns: str: Analysis results in a formatted string
| Name | Required | Description | Default |
|---|---|---|---|
| detailed | No | ||
| jtl_file | Yes |
| Name | Required | Description |
|---|---|---|
| result | Yes |
Does the description disclose side effects, auth requirements, rate limits, or destructive behavior?
No annotations are provided, so the description carries the full burden of behavioral disclosure. It states the tool analyzes results and returns a formatted string, but lacks details on permissions, rate limits, error handling, or whether it modifies data. For a tool with no annotations, this is insufficient to inform safe and effective usage.
Agents need to know what a tool does to the world before calling it. Descriptions should go beyond structured annotations to explain consequences.
Is the description appropriately sized, front-loaded, and free of redundancy?
The description is appropriately sized and front-loaded, with the core purpose stated first, followed by parameter and return value sections. Each sentence adds value, but the structure could be slightly improved by integrating usage context. Overall, it is efficient with minimal waste.
Shorter descriptions cost fewer tokens and are easier for agents to parse. Every sentence should earn its place.
Given the tool's complexity, does the description cover enough for an agent to succeed on first attempt?
Given the tool's complexity (2 parameters, no annotations, but with an output schema), the description is moderately complete. It explains the purpose and parameters but lacks behavioral details and usage guidelines. The output schema indicates returns are a string, so the description need not elaborate on return values, but overall gaps remain in guiding effective tool selection and invocation.
Complex tools with many parameters or behaviors need more documentation. Simple tools need less. This dimension scales expectations accordingly.
Does the description clarify parameter syntax, constraints, interactions, or defaults beyond what the schema provides?
Schema description coverage is 0%, so the description must compensate. It adds meaning by explaining 'jtl_file' as 'Path to the JTL file containing test results' and 'detailed' as 'Whether to include detailed analysis (default: False)', which clarifies their roles beyond the schema's basic types. However, it does not cover all potential nuances, such as file format requirements or what 'detailed' entails specifically.
Input schemas describe structure but not intent. Descriptions should explain non-obvious parameter relationships and valid value ranges.
Does the description clearly state what the tool does and how it differs from similar tools?
The description clearly states the tool's purpose: 'Analyze JMeter test results and provide a summary of key metrics and insights.' It specifies the verb ('analyze') and resource ('JMeter test results'), but does not explicitly differentiate it from sibling tools like 'get_performance_insights' or 'identify_performance_bottlenecks', which might have overlapping purposes. This makes it clear but not fully distinct from alternatives.
Agents choose between tools based on descriptions. A clear purpose with a specific verb and resource helps agents select the right tool.
Does the description explain when to use this tool, when not to, or what alternatives exist?
The description provides no guidance on when to use this tool versus its siblings. It mentions analyzing JMeter results but does not specify scenarios, prerequisites, or exclusions compared to tools like 'generate_visualization' or 'get_performance_insights'. Without such context, users might struggle to select the appropriate tool among similar options.
Agents often have multiple tools that could apply. Explicit usage guidance like "use X instead of Y when Z" prevents misuse.
Execute a JMeter test.
Args: test_file: Path to the JMeter test file (.jmx) gui_mode: Whether to run in GUI mode (default: False) properties: Dictionary of JMeter properties to pass with -J (default: None)
| Name | Required | Description | Default |
|---|---|---|---|
| gui_mode | No | ||
| properties | No | ||
| test_file | Yes |
| Name | Required | Description |
|---|---|---|
| result | Yes |
Does the description disclose side effects, auth requirements, rate limits, or destructive behavior?
With no annotations provided, the description carries full burden for behavioral disclosure. It mentions GUI mode and properties passing, but doesn't cover critical aspects like execution environment requirements, error handling, output format, or whether this is a blocking/long-running operation. For a test execution tool with zero annotation coverage, this is insufficient.
Agents need to know what a tool does to the world before calling it. Descriptions should go beyond structured annotations to explain consequences.
Is the description appropriately sized, front-loaded, and free of redundancy?
The description is perfectly structured: a clear purpose statement followed by well-organized parameter documentation. Every sentence earns its place, and the information is front-loaded with the most important details first.
Shorter descriptions cost fewer tokens and are easier for agents to parse. Every sentence should earn its place.
Given the tool's complexity, does the description cover enough for an agent to succeed on first attempt?
Given the tool has an output schema (which handles return values), 3 parameters with 0% schema coverage, and no annotations, the description does an adequate job documenting parameters but lacks behavioral context. For a test execution tool, it should mention what happens during execution and what kind of results to expect.
Complex tools with many parameters or behaviors need more documentation. Simple tools need less. This dimension scales expectations accordingly.
Does the description clarify parameter syntax, constraints, interactions, or defaults beyond what the schema provides?
The description provides clear parameter documentation in the Args section, explaining what each parameter does. With 0% schema description coverage, this description fully compensates by documenting all 3 parameters with their purposes and defaults, adding significant value beyond the bare schema.
Input schemas describe structure but not intent. Descriptions should explain non-obvious parameter relationships and valid value ranges.
Does the description clearly state what the tool does and how it differs from similar tools?
The description clearly states the verb 'Execute' and the resource 'JMeter test', making the purpose immediately understandable. However, it doesn't differentiate from sibling tools like 'execute_jmeter_test_non_gui', which appears to be a more specific version of this tool.
Agents choose between tools based on descriptions. A clear purpose with a specific verb and resource helps agents select the right tool.
Does the description explain when to use this tool, when not to, or what alternatives exist?
The description provides no guidance on when to use this tool versus alternatives like 'execute_jmeter_test_non_gui' or other sibling tools. There's no mention of prerequisites, typical use cases, or when to choose GUI vs non-GUI mode.
Agents often have multiple tools that could apply. Explicit usage guidance like "use X instead of Y when Z" prevents misuse.
Execute a JMeter test in non-GUI mode - supports JMeter properties.
Args: test_file: Path to the JMeter test file (.jmx) properties: Dictionary of JMeter properties to pass with -J (default: None) generate_report: Whether to generate report dashboard after load test (default: False) report_output_dir: Output folder for report dashboard (default: None) log_file: Name of JTL file to log sample results to (default: None)
| Name | Required | Description | Default |
|---|---|---|---|
| generate_report | No | ||
| log_file | No | ||
| properties | No | ||
| report_output_dir | No | ||
| test_file | Yes |
| Name | Required | Description |
|---|---|---|
| result | Yes |
Does the description disclose side effects, auth requirements, rate limits, or destructive behavior?
With no annotations provided, the description carries the full burden of behavioral disclosure. It mentions that the tool 'supports JMeter properties' and describes default values for parameters, but lacks critical behavioral details such as execution time, resource requirements, error handling, output format (though an output schema exists), or whether it's a long-running or blocking operation. For a tool that executes load tests, this is a significant gap.
Agents need to know what a tool does to the world before calling it. Descriptions should go beyond structured annotations to explain consequences.
Is the description appropriately sized, front-loaded, and free of redundancy?
The description is efficiently structured with a clear opening sentence stating the purpose, followed by a well-organized 'Args:' section listing each parameter with concise explanations. Every sentence earns its place, and there is no redundant or verbose content. It's appropriately sized for a tool with multiple parameters.
Shorter descriptions cost fewer tokens and are easier for agents to parse. Every sentence should earn its place.
Given the tool's complexity, does the description cover enough for an agent to succeed on first attempt?
Given the complexity of executing a JMeter test (a non-trivial operation with 5 parameters, nested objects, and an output schema), the description is partially complete. It covers parameters well but lacks behavioral context (e.g., execution characteristics, prerequisites). The presence of an output schema reduces the need to describe return values, but overall, the description doesn't fully address the tool's operational context, especially with no annotations to supplement it.
Complex tools with many parameters or behaviors need more documentation. Simple tools need less. This dimension scales expectations accordingly.
Does the description clarify parameter syntax, constraints, interactions, or defaults beyond what the schema provides?
Schema description coverage is 0%, so the description must fully compensate. It successfully documents all 5 parameters with clear explanations of their purposes, default values, and formats (e.g., 'Path to the JMeter test file (.jmx)', 'Dictionary of JMeter properties to pass with -J'). The description adds substantial meaning beyond the bare schema, though it could benefit from examples or constraints (e.g., file path formats).
Input schemas describe structure but not intent. Descriptions should explain non-obvious parameter relationships and valid value ranges.
Does the description clearly state what the tool does and how it differs from similar tools?
The description clearly states the action ('Execute a JMeter test in non-GUI mode') and the resource ('JMeter test file'), making the purpose immediately understandable. It distinguishes from the sibling 'execute_jmeter_test' by specifying 'non-GUI mode', though it doesn't explicitly contrast with other siblings like 'analyze_jmeter_results' or 'generate_visualization'.
Agents choose between tools based on descriptions. A clear purpose with a specific verb and resource helps agents select the right tool.
Does the description explain when to use this tool, when not to, or what alternatives exist?
The description provides no guidance on when to use this tool versus alternatives. It doesn't mention when to choose non-GUI mode over GUI mode (implied by the sibling 'execute_jmeter_test'), or how it relates to other siblings like 'analyze_jmeter_results' or 'generate_visualization'. Usage context is entirely absent.
Agents often have multiple tools that could apply. Explicit usage guidance like "use X instead of Y when Z" prevents misuse.
Generate visualizations of JMeter test results.
Args: jtl_file: Path to the JTL file containing test results visualization_type: Type of visualization to generate (time_series, distribution, comparison, html_report) output_file: Path to save the visualization
Returns: str: Path to the generated visualization file
| Name | Required | Description | Default |
|---|---|---|---|
| jtl_file | Yes | ||
| output_file | Yes | ||
| visualization_type | Yes |
| Name | Required | Description |
|---|---|---|
| result | Yes |
Does the description disclose side effects, auth requirements, rate limits, or destructive behavior?
No annotations are provided, so the description carries the full burden of behavioral disclosure. It mentions generating visualizations and returning a file path, but lacks details on permissions, file system interactions, error handling, or performance characteristics. For a tool with 3 parameters and no annotation coverage, this is a significant gap.
Agents need to know what a tool does to the world before calling it. Descriptions should go beyond structured annotations to explain consequences.
Is the description appropriately sized, front-loaded, and free of redundancy?
The description is well-structured and appropriately sized. It starts with a clear purpose statement, followed by parameter and return value sections. Each sentence adds value without redundancy. Minor improvements could include briefer formatting, but it's efficient overall.
Shorter descriptions cost fewer tokens and are easier for agents to parse. Every sentence should earn its place.
Given the tool's complexity, does the description cover enough for an agent to succeed on first attempt?
Given 3 parameters with 0% schema coverage and no annotations, the description provides basic parameter semantics and mentions the return value. However, it lacks behavioral context (e.g., side effects, error cases) and doesn't fully compensate for the missing schema details. The output schema exists, so return values are covered, but overall completeness is moderate.
Complex tools with many parameters or behaviors need more documentation. Simple tools need less. This dimension scales expectations accordingly.
Does the description clarify parameter syntax, constraints, interactions, or defaults beyond what the schema provides?
Schema description coverage is 0%, so the schema provides no parameter details. The description compensates by listing all 3 parameters with brief explanations (e.g., 'Path to the JTL file', 'Type of visualization to generate'). However, it doesn't elaborate on allowed values for 'visualization_type' or file format expectations, leaving gaps.
Input schemas describe structure but not intent. Descriptions should explain non-obvious parameter relationships and valid value ranges.
Does the description clearly state what the tool does and how it differs from similar tools?
The description clearly states the tool's purpose: 'Generate visualizations of JMeter test results.' It specifies the verb ('generate') and resource ('visualizations of JMeter test results'), making it easy to understand what the tool does. However, it doesn't explicitly differentiate from sibling tools like 'analyze_jmeter_results' or 'get_performance_insights', which might also involve result processing.
Agents choose between tools based on descriptions. A clear purpose with a specific verb and resource helps agents select the right tool.
Does the description explain when to use this tool, when not to, or what alternatives exist?
The description provides no guidance on when to use this tool versus alternatives. It doesn't mention sibling tools like 'analyze_jmeter_results' or 'get_performance_insights', nor does it specify prerequisites (e.g., needing a JTL file from a completed test). Usage is implied but not explicitly stated.
Agents often have multiple tools that could apply. Explicit usage guidance like "use X instead of Y when Z" prevents misuse.
Get insights and recommendations for improving performance based on JMeter test results.
Args: jtl_file: Path to the JTL file containing test results
Returns: str: Performance insights and recommendations in a formatted string
| Name | Required | Description | Default |
|---|---|---|---|
| jtl_file | Yes |
| Name | Required | Description |
|---|---|---|
| result | Yes |
Does the description disclose side effects, auth requirements, rate limits, or destructive behavior?
No annotations are provided, so the description carries the full burden of behavioral disclosure. It states the tool returns 'insights and recommendations in a formatted string,' which gives some output context, but lacks details on permissions, rate limits, error handling, or whether it's read-only/destructive. For a tool with no annotation coverage, this leaves significant behavioral gaps.
Agents need to know what a tool does to the world before calling it. Descriptions should go beyond structured annotations to explain consequences.
Is the description appropriately sized, front-loaded, and free of redundancy?
The description is appropriately sized and front-loaded: the first sentence clearly states the purpose, followed by structured 'Args' and 'Returns' sections. However, the 'Args' and 'Returns' labels are somewhat redundant since the schema and output schema exist, and the content could be more integrated. It's efficient but not perfectly streamlined.
Shorter descriptions cost fewer tokens and are easier for agents to parse. Every sentence should earn its place.
Given the tool's complexity, does the description cover enough for an agent to succeed on first attempt?
Given 1 parameter, 0% schema description coverage, no annotations, and an output schema (which handles return values), the description is moderately complete. It covers the basic purpose and parameter intent, but lacks usage guidelines, behavioral details, and differentiation from siblings. For a simple tool, it's adequate but has clear gaps in context.
Complex tools with many parameters or behaviors need more documentation. Simple tools need less. This dimension scales expectations accordingly.
Does the description clarify parameter syntax, constraints, interactions, or defaults beyond what the schema provides?
The description adds minimal parameter semantics: it defines 'jtl_file' as 'Path to the JTL file containing test results,' which clarifies the parameter's purpose beyond the schema's basic type. However, with 0% schema description coverage and only 1 parameter, this provides some value but doesn't fully compensate for the lack of schema details (e.g., file format expectations, path validation). The baseline is 3 due to the single parameter, but the description's addition is limited.
Input schemas describe structure but not intent. Descriptions should explain non-obvious parameter relationships and valid value ranges.
Does the description clearly state what the tool does and how it differs from similar tools?
The description clearly states the tool's purpose: 'Get insights and recommendations for improving performance based on JMeter test results.' It specifies the verb ('Get'), resource ('insights and recommendations'), and source ('JMeter test results'). However, it doesn't explicitly differentiate from sibling tools like 'analyze_jmeter_results' or 'identify_performance_bottlenecks', which likely have overlapping functionality.
Agents choose between tools based on descriptions. A clear purpose with a specific verb and resource helps agents select the right tool.
Does the description explain when to use this tool, when not to, or what alternatives exist?
The description provides no guidance on when to use this tool versus alternatives. With siblings like 'analyze_jmeter_results' and 'identify_performance_bottlenecks' that likely process JMeter results, there's no indication of what distinguishes this tool (e.g., focus on recommendations vs. raw analysis). The only implied context is having JMeter test results, but no explicit when/when-not or alternative tool references.
Agents often have multiple tools that could apply. Explicit usage guidance like "use X instead of Y when Z" prevents misuse.
Identify performance bottlenecks in JMeter test results.
Args: jtl_file: Path to the JTL file containing test results
Returns: str: Bottleneck analysis results in a formatted string
| Name | Required | Description | Default |
|---|---|---|---|
| jtl_file | Yes |
| Name | Required | Description |
|---|---|---|
| result | Yes |
Does the description disclose side effects, auth requirements, rate limits, or destructive behavior?
No annotations are provided, so the description carries the full burden of behavioral disclosure. It mentions the input (JTL file) and output (formatted string of bottleneck analysis), but lacks details on how the analysis works (e.g., algorithms used, what constitutes a bottleneck), error handling, performance characteristics, or any side effects. For a tool with no annotation coverage, this is a significant gap in transparency.
Agents need to know what a tool does to the world before calling it. Descriptions should go beyond structured annotations to explain consequences.
Is the description appropriately sized, front-loaded, and free of redundancy?
The description is appropriately sized and front-loaded: the first sentence clearly states the purpose, followed by structured sections for 'Args' and 'Returns' that efficiently document inputs and outputs. Every sentence earns its place with no redundant information, making it easy to scan and understand quickly.
Shorter descriptions cost fewer tokens and are easier for agents to parse. Every sentence should earn its place.
Given the tool's complexity, does the description cover enough for an agent to succeed on first attempt?
Given the tool's complexity (performance analysis with one parameter), no annotations, and an output schema exists (implied by 'Returns: str'), the description is moderately complete. It covers the basic purpose and parameters but lacks behavioral details (e.g., analysis methodology, error cases) and doesn't leverage the output schema to explain return values beyond a generic 'formatted string.' For a tool with no annotations, it should do more to compensate.
Complex tools with many parameters or behaviors need more documentation. Simple tools need less. This dimension scales expectations accordingly.
Does the description clarify parameter syntax, constraints, interactions, or defaults beyond what the schema provides?
The description adds minimal semantics beyond the input schema: it specifies that 'jtl_file' is a 'Path to the JTL file containing test results,' which clarifies the parameter's purpose. However, with 0% schema description coverage and only one parameter, the baseline is 4 for zero parameters, but here the description compensates somewhat by explaining the parameter's role. It doesn't provide format details (e.g., file path conventions, JTL structure), so it partially compensates but not fully.
Input schemas describe structure but not intent. Descriptions should explain non-obvious parameter relationships and valid value ranges.
Does the description clearly state what the tool does and how it differs from similar tools?
The description clearly states the tool's purpose: 'Identify performance bottlenecks in JMeter test results.' It specifies the verb ('identify') and resource ('performance bottlenecks'), and distinguishes it from siblings like 'analyze_jmeter_results' or 'get_performance_insights' by focusing specifically on bottleneck detection. However, it doesn't explicitly differentiate from all siblings, such as 'generate_visualization' which might also involve performance analysis.
Agents choose between tools based on descriptions. A clear purpose with a specific verb and resource helps agents select the right tool.
Does the description explain when to use this tool, when not to, or what alternatives exist?
The description provides no guidance on when to use this tool versus alternatives. It doesn't mention prerequisites (e.g., needing a JTL file from a JMeter test), compare it to siblings like 'analyze_jmeter_results' or 'get_performance_insights', or specify contexts where bottleneck identification is preferred over other analyses. Usage is implied but not explicitly stated.
Agents often have multiple tools that could apply. Explicit usage guidance like "use X instead of Y when Z" prevents misuse.
Recent tool additions, removals, and schema changes observed during successful MCP inspections.
v1.0.0analyze_jmeter_resultsexecute_jmeter_testexecute_jmeter_test_non_guigenerate_visualizationget_performance_insightsidentify_performance_bottlenecksScored across 6 tools
Most tools have distinct purposes, but there is some overlap between analyze_jmeter_results, get_performance_insights, and identify_performance_bottlenecks, as all three analyze JTL files and provide insights. However, their descriptions differentiate them enough to avoid major confusion.
All tool names follow a consistent snake_case pattern with clear verb_noun structure, such as analyze_jmeter_results and execute_jmeter_test. The naming is uniform and predictable throughout the set.
With 6 tools, the count is well-scoped for a JMeter server, covering key operations like test execution, result analysis, and visualization. Each tool serves a clear purpose without redundancy.
The toolset covers core JMeter workflows including test execution, result analysis, and visualization, but lacks tools for test creation or modification. This minor gap does not severely hinder typical agent tasks.
A comprehensive Model Context Protocol (MCP) server that enables AI assistants to interact with yo…
Apache JMeter community documentation, conversion tools, linters, and calculators for AI agents.
MCP server for building and testing AI agents with multi-model experimentation and insights.
A Model Context Protocol server for Wix AI tools