A
licenseA
qualityD
maintenanceA lightweight server that provides real-time system information including CPU, memory, disk, and GPU statistics for monitoring and diagnostic purposes.
1
MIT

Provides real-time monitoring of NVIDIA GPU statistics, including utilization, temperature, and memory usage.
Click on "Deploy Server".
Wait a few minutes for the server to deploy. Once ready, it will show a "Started" state.
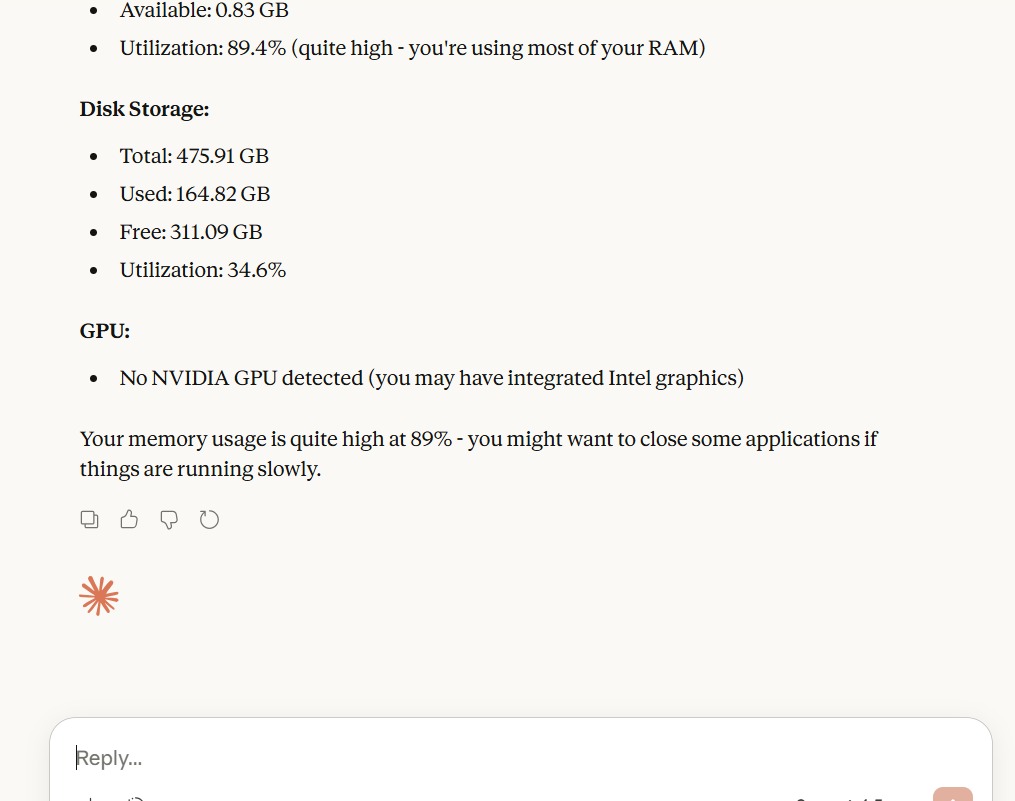
In the chat, type @ followed by the MCP server name and your instructions, e.g., "@MCP System Info Server Show me my current CPU, memory, and GPU usage."
That's it! The server will respond to your query, and you can continue using it as needed.
Here is a step-by-step guide with screenshots.
A lightweight MCP (Model Context Protocol) server that provides real-time system information including CPU, memory, disk, and GPU statistics.
Category | Information Provided |
System | System name, node name, OS release/version, machine type, processor |
CPU | Processor name, physical/logical cores, frequency, usage percentage |
Memory | Total, available, used memory (GB), utilization percentage |
Disk | Total, used, free space (GB), utilization percentage |
GPU | Name, memory (total/used/free), utilization, temperature (NVIDIA only) |
Related MCP server: System Stats MCP Server
Python 3.10+
uv - Fast Python package manager
# Clone or navigate to the project directory
cd mcp

# Install dependencies (handled automatically by uv)
uv sync
uv run sysinfo.pyuv run mcp dev sysinfo.pyAdd this to your Claude Desktop configuration file:
Windows: %APPDATA%\Claude\claude_desktop_config.json
{
  "mcpServers": {
    "sysinfo": {
      "command": "uv",
      "args": [
        "--directory",
        "PATH OF THE FOLDER",
        "run",
        "sysinfo.py"
      ]
    }
  }
}get_sysinfoReturns comprehensive system information as a JSON object:
{
  "system": {
    "system_name": "Windows",
    "node_name": "DESKTOP-XXX",
    "os_release": "10",
    "os_version": "10.0.19045",
    "machine_type": "AMD64",
    "processor": "Intel64 Family 6..."
  },
  "cpu": {
    "processor_name": "Intel Core i7-10700K",
    "physical_cores": 8,
    "logical_cores": 16,
    "cpu_frequency_mhz": 3800.0,
    "cpu_usage_percent": 12.5
  },
  "memory": {
    "total_gb": 32.0,
    "available_gb": 18.5,
    "used_gb": 13.5,
    "utilization_percent": 42.2
  },
  "disk": {
    "total_gb": 500.0,
    "used_gb": 280.0,
    "free_gb": 220.0,
    "utilization_percent": 56.0
  },
  "gpu": [
    {
      "id": 0,
      "name": "NVIDIA GeForce RTX 3080",
      "memory_total_mb": 10240.0,
      "memory_used_mb": 2048.0,
      "memory_free_mb": 8192.0,
      "gpu_utilization_percent": 15.0,
      "temperature_c": 45
    }
  ]
}mcp[cli] - MCP SDK with CLI support
psutil - Cross-platform system information
GPUtil - NVIDIA GPU information
py-cpuinfo - Detailed CPU information
Get comprehensive system information.

Returns detailed information about the system including:
- System: OS name, version, machine type
- CPU: Processor name, cores, frequency, usage
- Memory: Total, available, used memory and utilization
- Disk: Total, used, free disk space and utilization
- GPU: NVIDIA GPU details if available (name, memory, utilization, temperature)
| Name | Required | Description | Default |
|---|---|---|---|
No parameters | |||
| Name | Required | Description |
|---|---|---|
No output parameters | ||
Does the description disclose side effects, auth requirements, rate limits, or destructive behavior?
No annotations are provided, so the description carries the full burden. It discloses the return format in detail (system, CPU, memory, disk, GPU information), which is valuable behavioral context. However, it doesn't mention potential limitations like performance impact, permissions needed, or error conditions.
Agents need to know what a tool does to the world before calling it. Descriptions should go beyond structured annotations to explain consequences.
Is the description appropriately sized, front-loaded, and free of redundancy?
The description is well-structured and front-loaded with the main purpose, followed by a bulleted list of return details. It's appropriately sized with no redundant information, though it could be slightly more concise by integrating the bullet points into a single sentence.
Shorter descriptions cost fewer tokens and are easier for agents to parse. Every sentence should earn its place.
Given the tool's complexity, does the description cover enough for an agent to succeed on first attempt?
Given the tool's complexity (system monitoring), no annotations, and an output schema present, the description provides good completeness by detailing the return values. It covers key aspects like OS, CPU, memory, disk, and GPU, but could improve by mentioning data freshness or update frequency.
Complex tools with many parameters or behaviors need more documentation. Simple tools need less. This dimension scales expectations accordingly.
Does the description clarify parameter syntax, constraints, interactions, or defaults beyond what the schema provides?
The input schema has 0 parameters with 100% coverage, so the baseline is 4. The description appropriately doesn't discuss parameters, focusing instead on the output, which aligns with the tool's no-parameter design.
Input schemas describe structure but not intent. Descriptions should explain non-obvious parameter relationships and valid value ranges.
Does the description clearly state what the tool does and how it differs from similar tools?
The description clearly states the tool's purpose with the verb 'Get' and resource 'comprehensive system information', making it immediately understandable. However, it doesn't distinguish from sibling tools since there are none, so it cannot achieve a perfect score of 5 for sibling differentiation.
Agents choose between tools based on descriptions. A clear purpose with a specific verb and resource helps agents select the right tool.
Does the description explain when to use this tool, when not to, or what alternatives exist?
The description provides no guidance on when to use this tool versus alternatives, prerequisites, or specific contexts. It simply states what the tool does without any usage instructions or exclusions.
Agents often have multiple tools that could apply. Explicit usage guidance like "use X instead of Y when Z" prevents misuse.
Recent tool additions, removals, and schema changes observed during successful MCP inspections.
get_sysinfoScored across 1 tool
With only one tool, there is no possibility of ambiguity or overlap between tools. The single tool 'get_sysinfo' has a clearly defined and distinct purpose of retrieving comprehensive system information.
Since there is only one tool, naming consistency is inherently perfect. The tool name 'get_sysinfo' follows a clear verb_noun pattern, and there are no other tools to create inconsistency.
A single tool is generally too few for a server's purpose, as it limits functionality and scope. For a system info server, one tool might be insufficient for covering potential needs like monitoring specific components or historical data, making it feel thin and under-scoped.
The tool provides comprehensive system information in one call, but there are significant gaps for a system info domain. Missing operations include monitoring changes over time, querying specific subsystems individually, or performing actions like alerts or logs, which limits agent workflows and could lead to failures in dynamic scenarios.
MCP server for OpenAI API (chat completions, image generation, embeddings) via AceDataCloud
MCP server for Hostinger API
Live health and AI-readable metadata of invokera.com. Demo of an Invokera-hosted MCP server.
MCP server for AI dialogue using various LLM models via AceDataCloud