
Enables AI assistants to interact with Databricks workspaces through OAuth authentication, providing tools for managing clusters, executing SQL queries, creating jobs, and accessing workspace resources via the Databricks SDK
Click on "Install Server".
Wait a few minutes for the server to deploy. Once ready, it will show a "Started" state.
In the chat, type
@followed by the MCP server name and your instructions, e.g., "@Databricks MCP Servershow me the top 5 tables in the sales database"
That's it! The server will respond to your query, and you can continue using it as needed.
Here is a step-by-step guide with screenshots.
awesome-databricks-mcp
Host Model Context Protocol (MCP) prompts and tools on Databricks Apps, enabling AI assistants like Claude to interact with your Databricks workspace through a secure, authenticated interface.
What is this?
This template lets you create an MCP server that runs on Databricks Apps. You can:
📝 Add prompts as simple markdown files in the
prompts/folder🛠️ Create tools as Python functions that leverage Databricks SDK
🔐 Authenticate securely with OAuth through Databricks Apps
🚀 Deploy instantly to make your MCP server accessible to Claude
🖥️ Web Interface with a modern React TypeScript frontend for MCP discovery
🧪 Comprehensive Testing with automated MCP validation tools
🔄 CI/CD Pipeline with automated testing, security scanning, and deployment
📊 Advanced Dashboard Tools for building comprehensive Lakeview dashboards
🛡️ Security Features with comprehensive injection attack prevention and input validation
Think of it as a bridge between Claude and your Databricks workspace - you define what Claude can see and do, and this server handles the rest.
Related MCP server: Databricks MCP Server
How it Works
Architecture Overview
Components
MCP Server (
server/app.py): A FastAPI app with integrated MCP server that:Dynamically loads prompts from
prompts/*.mdfilesExposes Python functions as MCP tools via modular tool system
Handles both HTTP requests and MCP protocol over Server-Sent Events
Uses FastMCP framework for seamless MCP integration
React Frontend (
client/): A modern TypeScript React application that:Provides a web interface for MCP discovery and testing
Shows available prompts, tools, and MCP configuration
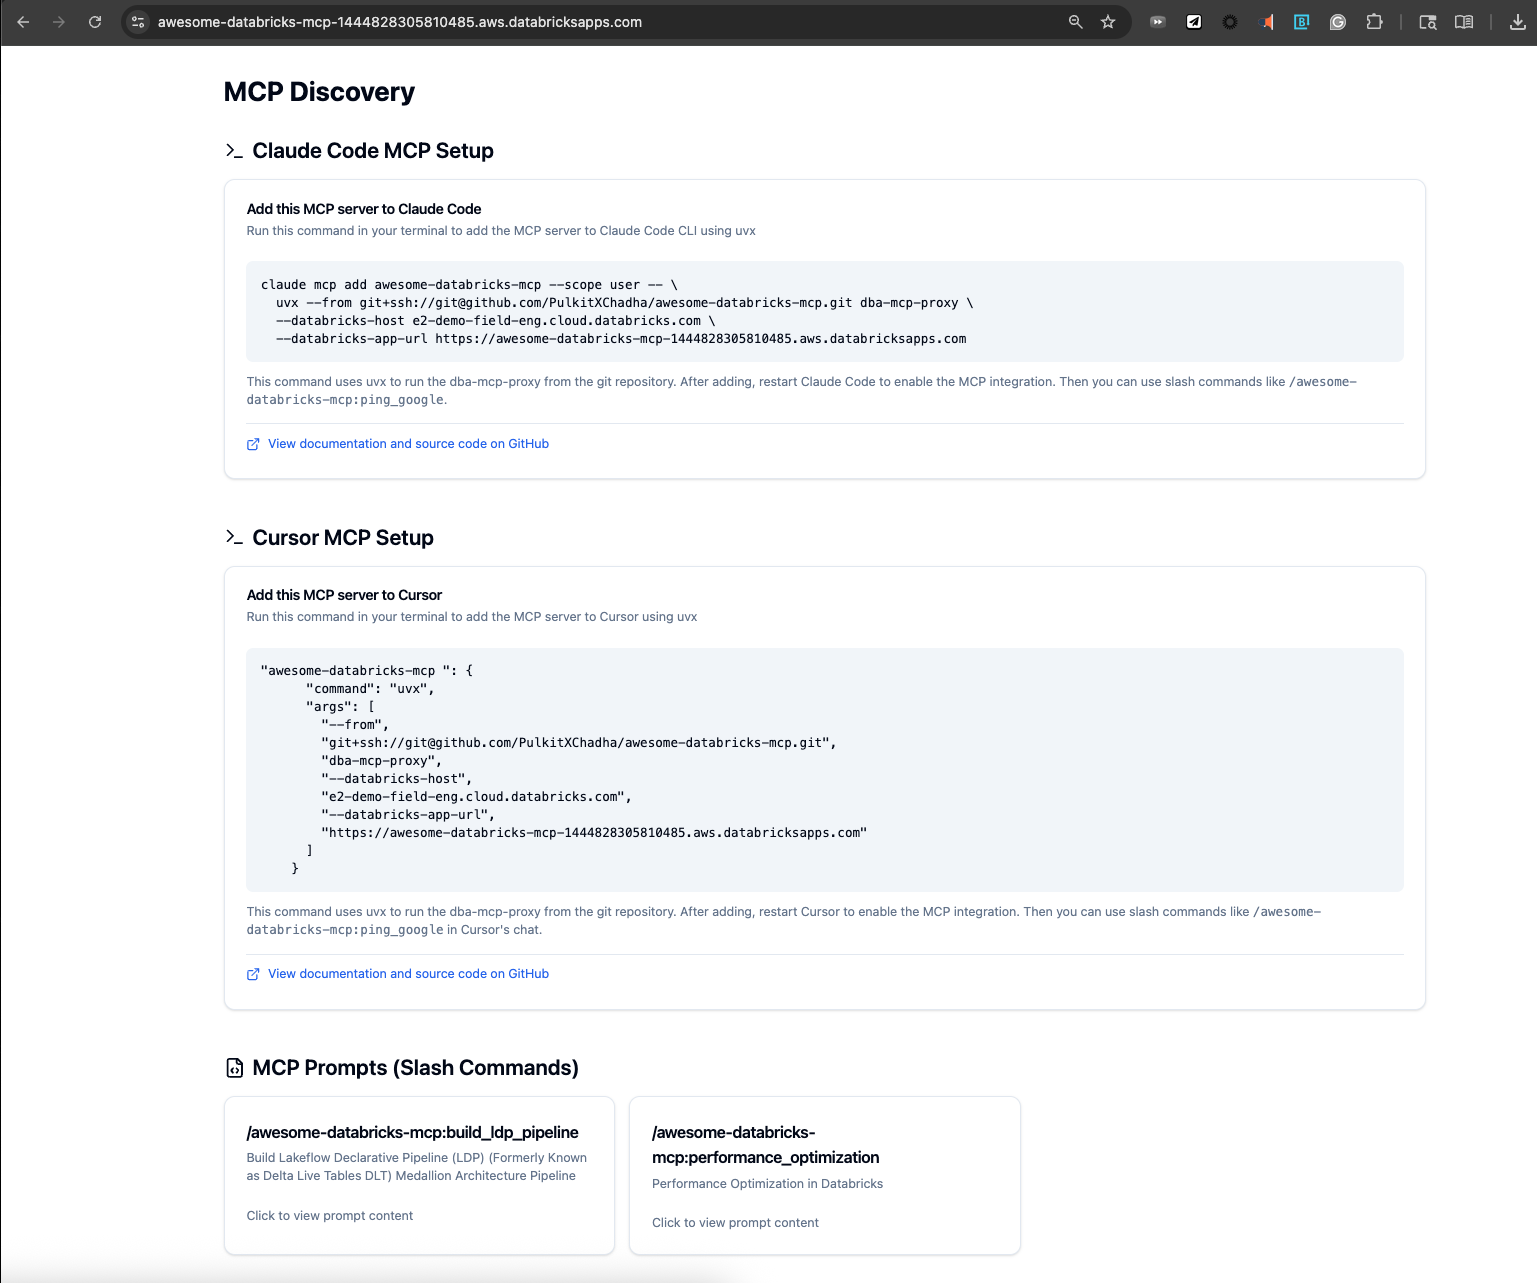
Includes copy-paste setup commands for Claude integration
Built with TailwindCSS, Radix UI, and modern React patterns
Uses Vite for fast development and building
Prompts (
prompts/): MCP-compliant markdown files with YAML frontmatter:YAML frontmatter: Required metadata defining prompt name, description, and arguments
Argument validation: Built-in validation for required arguments and data types
Placeholder substitution: Automatic replacement of
${argument}placeholdersSecurity: Input sanitization and validation to prevent injection attacks
Modular Tools System (
server/tools/): Organized tool modules that:Break down functionality into logical, manageable components
Provide 100+ tools across 9 specialized modules
Enable better maintainability and collaboration
Support easy addition of new tools
Local Proxy (
dba_mcp_proxy/): Authenticates and proxies MCP requests:Handles Databricks OAuth authentication automatically
Translates between Claude's stdio protocol and HTTP/SSE
Works with both local development and deployed apps
Comprehensive Testing Suite (
claude_scripts/): Automated validation tools:Local and remote MCP server testing
MCP protocol compliance validation
OAuth authentication flow testing
Web-based MCP Inspector for interactive testing
Security Features (
server/tools/security.py): Comprehensive security validation:SQL injection prevention with pattern detection
HTML/script injection prevention and sanitization
Dataset and field name validation
Widget configuration security validation
Input sanitization and escaping
🎬 Demo
This 5-minute video shows you how to set up and use the MCP server with Claude and/or Cursor: https://www.youtube.com/watch?v=_yPtm2iH04o
Quick Start
Create Your Own MCP Server
Step 1: Install Databricks CLI and Set Up GitHub SSH Access
Before you begin, make sure you have the Databricks CLI and GitHub SSH access configured.
Install Databricks CLI:
macOS:
Windows:
Linux:
Set Up GitHub SSH Access:
macOS:
Windows:
Linux:
Test GitHub SSH Connection:
Configure Git with SSH:
Step 2: Clone the Repo
This will:
Configure Databricks authentication
Set your MCP server name
Install all dependencies (Python + Node.js)
Create your
.env.localfile
Step 3: Deploy with Claude
In Claude Code, run:
This will:
Deploy your MCP server to Databricks Apps
Configure the MCP integration
Show you available prompts and tools
Then restart Claude Code to use your new MCP server.
Add to Claude CLI
After deployment, add your MCP server to Claude:
Local Development
Running Locally
Prerequisites
Before running the MCP server locally, ensure you have:
Python 3.11+ and Node.js 18+ installed
Databricks CLI configured with
databricks auth loginGit for cloning the repository
uv package manager (recommended) or pip for Python dependencies
bun (recommended) or npm for Node.js dependencies
Step-by-Step Local Setup
1. Clone and Configure
The setup script will:
Install Python dependencies using
uvorpipInstall Node.js dependencies using
bunornpmConfigure your Databricks workspace settings
Create a
.env.localfile with your configuration
2. Start the Development Server
This command starts:
Backend: FastAPI server on
http://localhost:8000Frontend: React development server on
http://localhost:3000File watching: Automatic reloading when files change
3. Verify Local Setup
Open your browser and navigate to:
Backend API: http://localhost:8000/docs (FastAPI Swagger UI)
Frontend: http://localhost:3000 (React application)
MCP Endpoint: http://localhost:8000/mcp/ (MCP server)
4. Test with Claude CLI
Development Workflow
Making Changes
Edit prompts: Modify files in
prompts/directoryEdit tools: Update functions in appropriate modules under
server/tools/Edit frontend: Modify React components in
client/src/Edit backend: Update FastAPI routes in
server/
All changes automatically reload thanks to the file watchers in ./watch.sh.
Creating New MCP Prompts
All prompts require YAML frontmatter for MCP compliance. Create a new markdown file in prompts/:
The YAML frontmatter provides:
Structured documentation: Clear definition of expected arguments
Future MCP compliance: Prepared for when FastMCP adds full argument support
Schema definitions: JSON Schema ready for validation
Argument metadata: Required/optional flags and descriptions
Note: FastMCP's current version doesn't support runtime argument validation in prompts, but the YAML metadata documents the expected interface for future compatibility.
Testing Changes
Debugging
Backend logs: Check terminal output from
./watch.shFrontend logs: Check browser console and terminal output
MCP logs: Monitor the
/mcp/endpoint responsesDatabase queries: Check Databricks workspace logs
Local vs Production Differences
Feature | Local Development | Production |
Authentication | Databricks CLI token | OAuth via Databricks Apps |
URL |
|
|
HTTPS | No (HTTP only) | Yes (HTTPS required) |
File watching | Yes (auto-reload) | No |
Debug mode | Yes | No |
Logs | Terminal output | Databricks Apps logs |
Troubleshooting Local Issues
Common Problems
Port conflicts:
Dependencies not found:
Databricks authentication:
MCP connection issues:
Performance Tips
Use
uvinstead ofpipfor faster Python dependency managementUse
buninstead ofnpmfor faster Node.js dependency managementThe
./watch.shscript usesuvicorn --reloadfor fast backend developmentFrontend uses Vite for fast hot module replacement
Deployment
Your MCP server will be available at https://your-app.databricksapps.com/mcp/
The app_status.sh script will show your deployed app URL, which you'll need for the DATABRICKS_APP_URL environment variable when adding the MCP server to Claude.
Authentication
Local Development: No authentication required
Production: OAuth is handled automatically by the proxy using your Databricks CLI credentials
Examples
Using with Claude
Once added, you can interact with your MCP server in Claude:
Sample Tool Usage
Project Structure
Modular Tools System
The MCP server features a modular tools architecture that organizes tools into logical, maintainable modules. Currently 5 active modules are loaded with 88+ tools available:
Active Tool Modules
Module Status Overview
Module | Status | Tools | Description |
core.py | ✅ Active | 1 | Basic health checks and core functionality |
sql_operations.py | ✅ Active | ~15 | SQL warehouse management, query execution, and monitoring |
unity_catalog.py | ✅ Active | ~21 | Catalog, schema, table, and metadata operations |
jobs_pipelines.py | ✅ Active | ~19 | Job and DLT pipeline management |
lakeview_dashboard.py | ✅ Active | ~3 | Comprehensive Lakeview dashboard creation and management |
data_management.py | 🚧 Available | ~10 | DBFS operations, external locations, storage credentials |
governance.py | 🚧 Available | ~15 | Audit logs, governance rules, and data lineage |
Total: 88+ tools with 59+ currently active across 5 modules
Benefits of Modularization
Maintainability: Each module focuses on a specific domain
Readability: Smaller files are easier to navigate and debug
Collaboration: Multiple developers can work on different modules simultaneously
Testing: Individual modules can be tested in isolation
Scalability: New tools can be added to appropriate modules without cluttering
Documentation: Each module has clear purpose and can be documented independently
Building Dashboards with MCP
Dashboard Tool Architecture
The dashboard system provides comprehensive Lakeview dashboard creation through focused tools:
Tool | Purpose | Key Features |
create_dashboard_file | Complete dashboard creation | Creates .lvdash.json files with full widget support |
validate_widget_fields | Widget validation | Ensures widget configurations match dataset schemas |
get_aggregation_expression | SQL optimization | Generates optimized aggregation expressions |
Key Capabilities:
16+ Widget Types: Full support for charts, displays, filters, and interactive elements
SQL Validation: Pre-deployment query testing and schema validation
Grid Layout System: 12-column responsive design with auto-positioning
Dataset Optimization: Smart query design for multiple widget support
Production Ready: Generates deployment-ready .lvdash.json files
Dashboard Building Quickstart
The MCP server provides comprehensive tools for building Lakeview and legacy dashboards programmatically. You can create, manage, and share dashboards using simple commands in Claude.
Tool Usage Examples
Creating a Complete Dashboard:
Dashboard Creation Result:
Basic Dashboard Creation
Widget Types Available
The MCP server supports all major widget types for dashboard creation:
Widget Type | Description | Use Case |
counter | Single metric display | KPIs, totals, counts |
table | Tabular data display | Detailed records, lists |
bar | Bar charts | Comparisons, categories |
line | Line charts | Trends over time |
pie | Pie charts | Proportions, distributions |
area | Area charts | Cumulative trends |
scatter | Scatter plots | Correlations, clusters |
pivot | Pivot tables | Multi-dimensional analysis |
funnel | Funnel charts | Conversion analysis |
box | Box plots | Statistical distributions |
heatmap | Heat maps | Density visualization |
markdown | Text/documentation | Explanations, headers |
SQL Query Guidelines
When building dashboards, follow these SQL best practices:
Layout and Positioning
Dashboards use a 12-column grid system for responsive layouts:
Common Dashboard Patterns
Executive Dashboard
Analytics Dashboard
Operational Dashboard
Dashboard Management
Listing and Discovery
Updating Dashboards
Sharing and Permissions
Best Practices
Start Simple: Begin with core metrics and expand iteratively
Use Consistent Styling: Maintain uniform colors and formatting
Optimize Queries: Use aggregations and filters to improve performance
Add Context: Include markdown widgets for explanations
Test Interactivity: Verify filters and parameters work correctly
Document Data Sources: Note which tables and schemas are used
Example: Complete Sales Dashboard
The dashboard will be interactive with date range filters and drill-down capabilities.
Comprehensive Testing Suite
This template includes comprehensive testing tools for validating MCP functionality at multiple levels.
Testing Architecture
Quick Verification
After adding the MCP server to Claude, verify it's working:
Testing Scripts
The claude_scripts/ directory contains 9 comprehensive testing tools:
Command Line Tests
Interactive Web UI Tests
MCP Inspector Features:
🖥️ Web-based interface for interactive MCP server testing
🔧 Visual tool execution with parameter input forms
📊 Real-time request/response monitoring
🐛 Protocol-level debugging and error inspection
📋 Complete tool and resource discovery
🔄 Session management and connection status
Test Results Summary
Test | Status | Notes |
Local curl | ✅ Pass | Authentication & headers validated |
Local proxy | ✅ Pass | Full MCP protocol compliance |
Remote curl | ✅ Pass | OAuth authentication & headers validated |
Remote proxy | ✅ Pass | End-to-end OAuth + MCP working |
CI/CD Pipeline
The project now includes automated CI/CD workflows for quality assurance and deployment:
Continuous Integration
Automated Workflows
CI Pipeline (
.github/workflows/ci.yml):Runs on every push and pull request
Executes comprehensive test suite
Performs code quality checks (ruff, type checking)
Validates frontend build process
Ensures all dependencies are properly configured
Deployment Pipeline (
.github/workflows/deploy.yml):Automated deployment to Databricks Apps
Environment-specific configurations
Rollback capabilities
Deployment validation
Security Pipeline (
.github/workflows/security.yml):Automated security scanning
Dependency vulnerability checks
Code security analysis
Compliance reporting
Quality Assurance
The CI pipeline ensures:
Code Quality: Consistent formatting and linting
Type Safety: TypeScript and Python type checking
Test Coverage: Comprehensive test execution
Security: Automated vulnerability scanning
Performance: Build time and resource optimization
Advanced Usage
Environment Variables
Configure in .env.local:
Creating Complex Tools
Tools can access the full Databricks SDK:
Troubleshooting
Authentication errors: Run
databricks auth loginto refresh credentialsMCP not found: Ensure the app is deployed and accessible
Tool errors: Check logs at
https://your-app.databricksapps.com/logzMCP connection issues:
Check Claude logs:
tail -f ~/Library/Logs/Claude/*.logVerify the proxy works:
uvx --from git+ssh://... dba-mcp-proxy --helpTest with echo pipe:
echo "list your mcp commands" | claude
Cached version issues: If you get errors about missing arguments after an update:
# Clear uvx cache for this package rm -rf ~/.cache/uv/git-v0/checkouts/*/ # Or clear entire uv cache uv cache cleanFrontend build issues: Ensure Node.js dependencies are installed:
cd client bun install
Contributing
Fork the repository
Add your prompts and tools
Test locally with
./watch.shSubmit a pull request
License
See LICENSE.md